KPI Metrics for Medical Billing: A Scorecard With Targets, Owners, and Fixes
November 16, 2026 · 15 min read
Nine numbers, three different ways to calculate days in A/R, and why your benchmark may not be comparable to anyone else's.
The KPI metrics for medical billing that matter most are clean claim rate, denial rate, days in A/R, net collection rate, and cost to collect. Clean claim rate and first-pass resolution are leading indicators that warn you early; days in A/R and net collection rate are lagging indicators that confirm a problem after cash has already slowed. A common target set is a denial rate under 5%, days in A/R under 40, and a net collection rate of 95% or higher, but each of those depends on how the metric is defined.
Picture your billing vendor's monthly report. Collections are up, days in A/R is under 40, and the cover note says everything is on track. Then you notice the denial rate column is missing, and nobody can tell you what the write-off rate did while A/R was improving.
That gap is what this post is about. KPI lists are easy to find. What is harder is knowing which numbers predict trouble, which only confirm it, and which can quietly be gamed.
KPI Metrics for Medical Billing: The Scorecard at a Glance
Here is the whole thing on one screen. Definitions, sources, and fixes follow in the sections below.
| KPI | How it is calculated | Typical target | Type |
|---|---|---|---|
| Clean claim rate | Claims accepted with no edits or rejections ÷ total claims submitted | 95% or higher (published benchmarks range from above 90% to 98%) | Leading |
| First-pass resolution rate | Claims paid correctly on first submission ÷ total claims submitted | 90% minimum; 95% or higher is strong | Leading |
| Charge lag | Days from date of service to claim submission | A few days (published targets run from under 3 to under 7) | Leading |
| Denial rate | Denied claims ÷ claims remitted | Under 5% | Early lagging |
| Days in A/R | Net A/R ÷ average daily net revenue | Under 40; 30 to 35 or lower is strong | Lagging |
| A/R over 90 days | A/R older than 90 days ÷ total A/R | Under 20% (some sources say under 10%) | Lagging |
| Net collection rate | Payments ÷ (charges minus contractual adjustments) | 95% or higher | Lagging |
| Cost to collect | Total cost of running the revenue cycle ÷ total collections | No universal target; one benchmark source says 4% or lower | Lagging |
| Write-off rate | Write-offs ÷ net revenue | Under 3% | Lagging |
Treat these as starting ranges, not pass/fail grades. The benchmarks section below explains why.
What Are KPI Metrics in Medical Billing?
KPI metrics in medical billing are the measurable indicators that show how well a practice turns services into collected cash. They cover the full path of a claim: how accurately it is built, how often payers accept it, how fast it is paid, and how much of the collectible amount you actually keep.
Healthcare has a formal standard for this. The Healthcare Financial Management Association (HFMA) publishes the HFMA MAP Keys, 29 revenue cycle KPIs in five groups: patient access, pre-billing, claims, account resolution, and financial management. HFMA describes them as KPIs tracked with objective, consistent calculations. Most small and mid-sized practices track a subset of these plus a few operational measures.
Leading vs. Lagging: The Split That Changes What You Do
Many KPI lists treat every metric as equal. They are not.
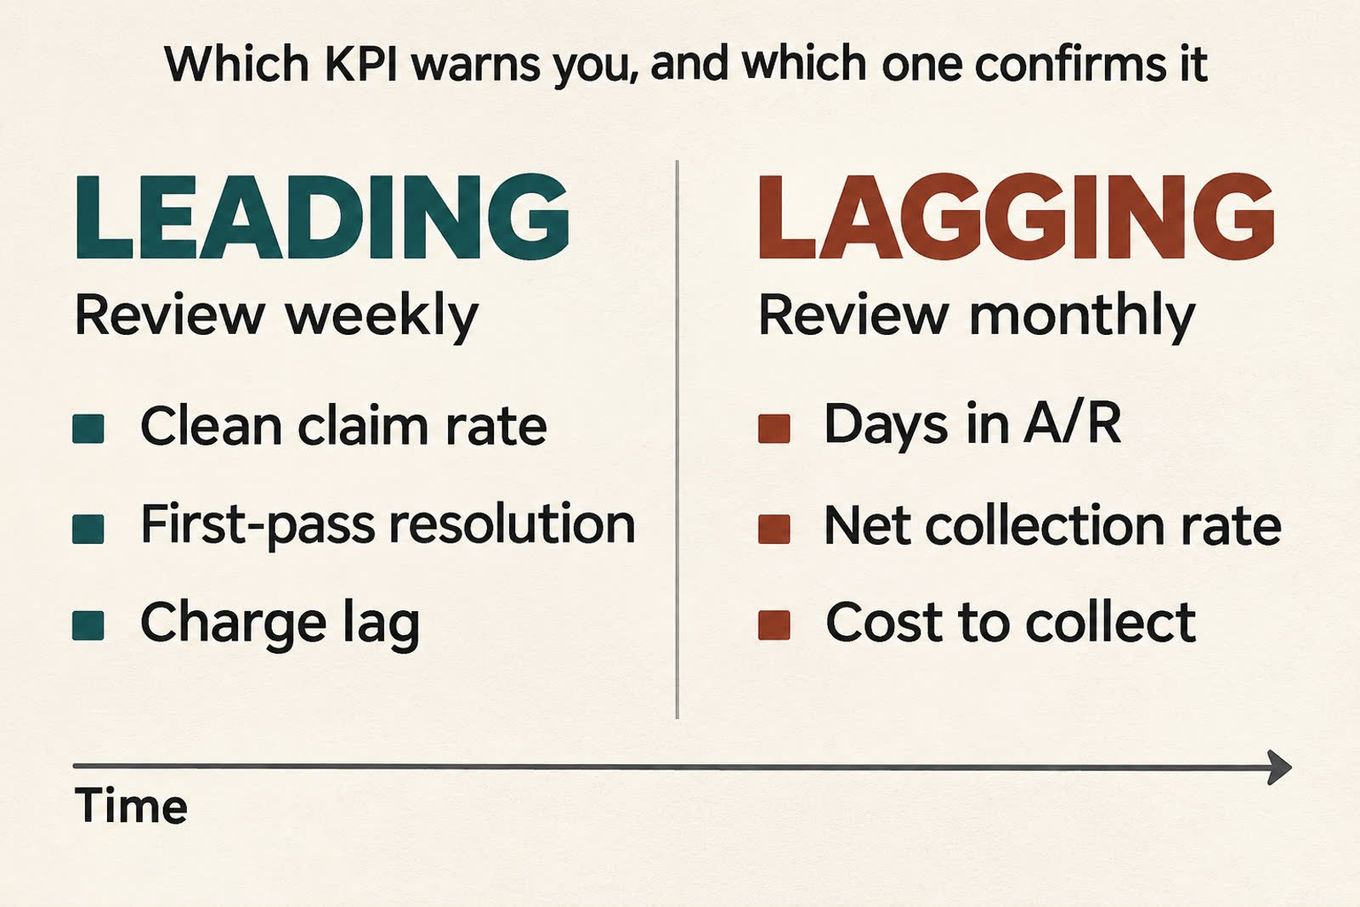
Leading indicators flag where revenue is about to be lost. Medheave's behavioral health benchmark guide lists clean claim rate, first-pass resolution, charge lag, and verification rate. If these slip, you still have time to act.
Lagging indicators confirm what already happened. The same guide lists days in A/R, net collection rate, and cost to collect. By the time these move, cash is already late or gone.
The practical rule: review leading indicators weekly and lagging indicators monthly. If you only watch the lagging ones, you will find out about a front-end problem one or two billing cycles too late.
The 9 KPI Metrics for Medical Billing, One at a Time
1. Clean claim rate
The share of claims a payer accepts on submission with no edits, rejections, or requests for more information.
Published benchmarks vary. A 2023 Conifer Health Solutions white paper hosted by MGMA lists 98%, citing Becker's ASC Review. ModMed cites a Journal of Medical Economics benchmark of greater than 90% for a well-run physician practice. Clarity's revenue cycle management services guide puts the industry benchmark around 95% and treats anything below 90% as a flag. A working target of 95% or higher fits the middle of that range.
If it is low: look upstream. Eligibility checks, demographic errors, missing authorizations, and coding edits are the usual causes. The same Clarity guide, citing the Change Healthcare Denials Index, attributes roughly 44% of claim denials to front-end issues such as eligibility errors and missing information. A claim scrubber catches only the errors its rules are built to find.
2. First-pass resolution rate
The share of claims paid correctly on first submission. This is stricter than clean claim rate: a claim can be accepted and still be underpaid or denied later. Clarity's accounts receivable management guide sets 90% as the minimum and 95% or higher as strong.
If it is low: compare it against clean claim rate. A big gap means claims are getting through the clearinghouse but failing at the payer, which points to payer-specific rules, medical necessity, or authorization.
3. Charge lag
Days between the date of service and claim submission. HFMA tracks it as a MAP Key (PB-4, Total Charge Lag Days). Published targets differ: Medheave lists under 3 days as healthy and over 5 as a warning, while the Conifer white paper lists a service-to-bill rate under 7 days. Pick a target, then trend it.
If it is high: the cause is usually documentation or charge entry rather than payer behavior. That is a workflow conversation inside the practice, not a vendor conversation.
4. Denial rate
The percentage of claims a payer denies. MGMA defines it as denied claims divided by claims remitted; HFMA's MAP Key AR-5 is the remittance denial rate. Under 5% is the common best-practice figure. Reported averages vary: the Conifer white paper gives an industry average of 5% to 10%, while Clarity's denial management guide cites an average closer to 11% to 12% across practice types. Either way, many practices are above target without realizing it.
If it is high: do not stop at the overall rate. Split it by payer, by CPT code, and by reason code. A single payer or a single denial reason is often responsible for most of the damage.
5. Days in A/R
The average number of days it takes to collect what you are owed. Clarity's accounts receivable guide calls under 40 days the standard target for a well-managed outpatient physician practice and 30 to 35 days or lower high-performing. The Conifer white paper lists 30 to 40 days as optimal, and the Maryland Local Health Department Billing Manual says top performers run under 35, typical practices land between 35 and 50, and anything over 50 signals a need to improve.
If it is high: open the aging report before changing anything. A high average can come from a few very old balances or from slow payment across the board, and the fixes are different.
6. A/R over 90 days
The share of your receivables older than 90 days. Days in A/R can look healthy while this number climbs, because an average hides a long tail. Clarity's guide sets 20% or less of total A/R as the target; the Conifer white paper lists under 10%. We use under 20% as a working ceiling.
If it is high: work the oldest, highest-dollar balances first and check each payer's timely filing limit. Claims past a filing window can be unrecoverable.
7. Net collection rate
The percentage of the collectible amount you actually collect, calculated as payments divided by charges minus contractual adjustments. The Maryland manual says most practices fall between 95% and 99% and that a rate below 95% usually points to a revenue cycle problem. The Conifer white paper lists 95% as the minimum and 97% to 99% as optimal.
Medical Economics notes that a gap between allowed and collected amounts points to lost revenue from uncollectable debt, untimely filing, and other non-contractual adjustments. It also recommends measuring over at least a year, such as a rolling 12 months, so one noisy month does not mislead you.
If it is low: check for denials that were never worked, claims missed for timely filing, underpayments written off as contractual adjustments, and uncollected patient balances.
8. Cost to collect
What it costs to run the revenue cycle as a share of what you collect. It is an HFMA MAP Key (FM-6), but there is no universal target. Medheave lists 4% or lower as healthy and over 6% as a warning, attributing the 4% figure to ICANotes benchmarking. Because what counts as a cost varies by organization, compare yourself only against numbers that use the same definition.
If it is high: look at rework volume. Repeated touches on the same claim are a common driver.
9. Write-off rate
How much revenue is written off as uncollectible, relative to net revenue. Clarity's accounts receivable guide sets under 3% for a well-run operation. This is the metric that keeps the others honest, and it gets its own section next.
The Trap: When a Good Number Hides a Bad One
Days in A/R can improve for the wrong reason. Clarity's accounts receivable guide puts it plainly: like denial rate, days in A/R can be gamed through write-offs, because writing off the oldest and hardest claims makes the average look better.

The check is simple: never read days in A/R without net collection rate and write-off rate beside it. If days in A/R improves while net collection rate falls, balances are probably being cleared by write-off rather than by payment.
The same logic applies to any single-number dashboard. A vendor that reports only days in A/R and clean claim rate is showing you a small slice of the scorecard above.
Why Benchmarks Disagree (and Which One to Use)
If you have searched for targets, you have seen conflicting numbers. The disagreement is real, and it has three causes.
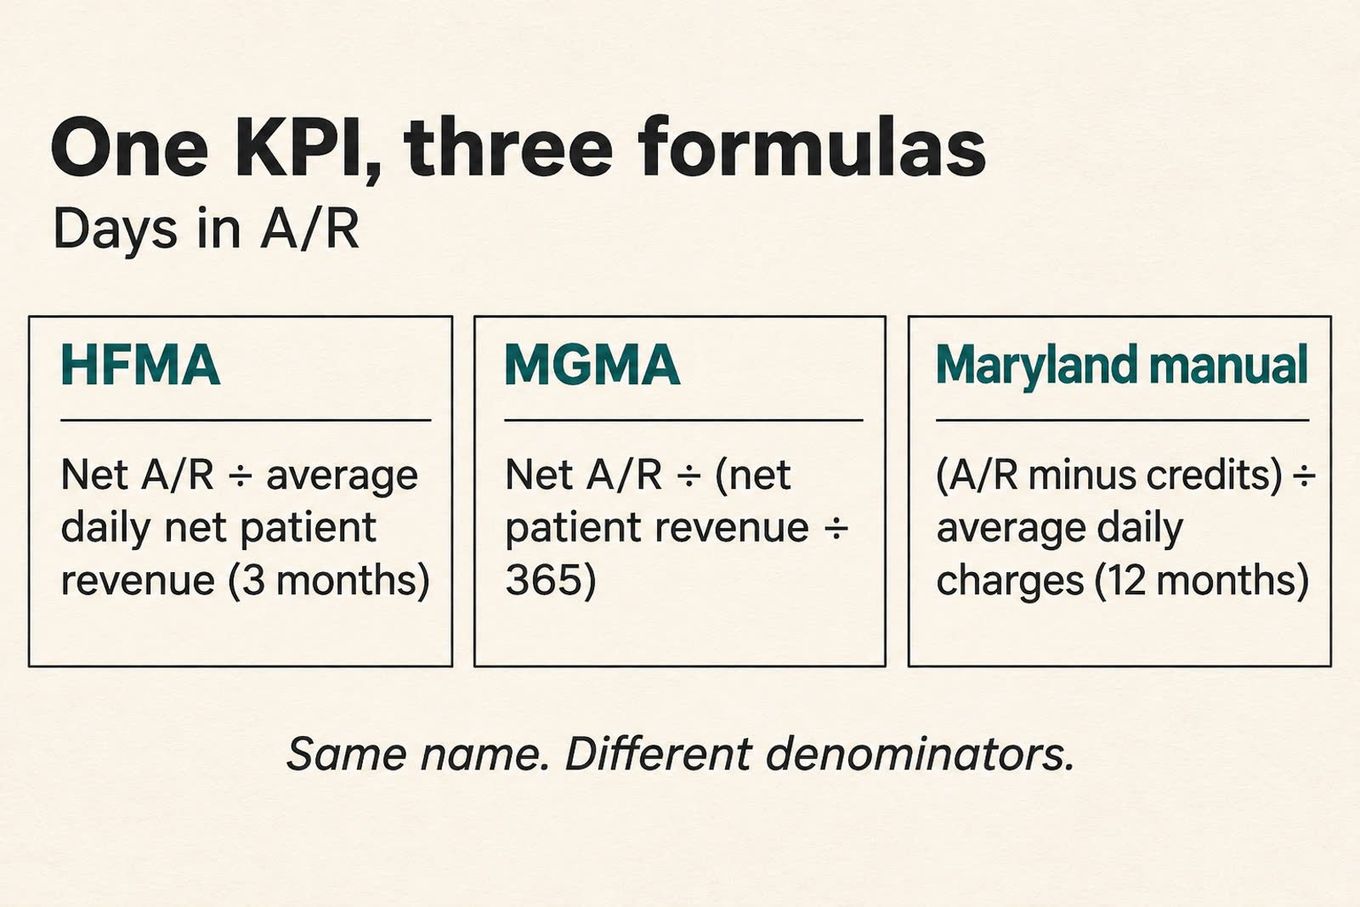
Definitions differ. Take days in A/R. Three published sources calculate it three ways:
| Source | Calculation |
|---|---|
| HFMA MAP Keys (FM-1) | Net A/R ÷ average daily net patient service revenue, using the most recent three months of revenue |
| MGMA | Total net A/R ÷ (total net patient revenue ÷ 365) |
| Maryland Local Health Department Billing Manual (2016) | Total current A/R minus credits ÷ average daily charge amount, based on 12 months of charges |
Same name, different denominators.
Even gross collection rate has two definitions: a common one divides payments by total billed charges, while the Maryland manual divides payments by payments plus adjustments.
Published targets differ. The same KPI gets different targets depending on the source:
| KPI | Published targets |
|---|---|
| Days in A/R | Under 40 (Clarity); 30 to 40 optimal (Conifer white paper); under 35 for top performers (Maryland manual) |
| Clean claim rate | Greater than 90% (ModMed); about 95% (Clarity); 98% (Conifer white paper) |
| A/R over 90 days | 20% or less (Clarity); under 10% (Conifer white paper) |
| Industry average denial rate | 5% to 10% (Conifer white paper); about 11% to 12% (Clarity) |
Many targets are secondhand. The Conifer white paper draws its figures from AAFP, MGMA, Becker's, and HealthIT Analytics. Medheave attributes parts of its table to other benchmarking publishers and gives no source for others. Clarity's accounts receivable guide advises validating thresholds against current HFMA MAP App benchmarking data.
What to do with that:
- Pick one written definition for each KPI and keep it fixed.
- Trend your own numbers month over month. Direction matters more than the absolute number.
- Compare to outside benchmarks only when the source states its definition.
- Use ranges, not single thresholds, and check them against current HFMA or MGMA data for your specialty and payer mix.
Behavioral Health Targets: What Changes
Behavioral and mental health practices track the same KPIs, but the claim mix changes how they behave. Session-based claims repeat a small set of time-based codes (90832, 90834, and 90837), so documented session time drives nearly every claim. Behavioral benefits are often carved out to separate payers such as Optum/UBH, Carelon, Evernorth, and Magellan, and timely authorizations determine whether claims are payable. Clarity's behavioral health billing page covers each of these.

One published set of thresholds for behavioral health practices, from Medheave (published March 2026, updated October 2026), looks like this:
| KPI | Healthy | Warning |
|---|---|---|
| Days in A/R | Under 40 | Over 50 |
| Clean claim rate | 95% or higher | Under 90% |
| Denial rate | Under 5% | Over 10% |
| Net collection rate | 95% or higher | Under 93% |
| First-pass resolution | 90% or higher | Under 80% |
| Charge lag | Under 3 days | Over 5 days |
| Cost to collect | 4% or lower | Over 6% |
Treat these as indicative, not a standard. Medheave attributes some of the thresholds to other publishers and gives no source for the denial rate, charge lag, or warning levels.
Who Owns Each KPI, and How Often to Review It
A KPI without an owner is just a report. Clarity's guide on questions to ask before hiring a medical billing company recommends weekly operational reports and a monthly executive KPI package. The table below is our suggested starting point for assigning them; adjust it to your team size.

| KPI | Suggested owner | Review cadence |
|---|---|---|
| Clean claim rate, first-pass resolution | Billing lead | Weekly |
| Charge lag | Practice manager | Weekly |
| Denial rate (by payer and reason) | Billing or denial lead | Weekly, with a monthly root-cause review |
| Days in A/R and aging buckets | Practice administrator | Monthly, with a weekly look at balances over 90 days |
| Net collection rate, write-off rate | Practice owner or finance | Monthly, on a rolling 12-month view |
| Cost to collect | Practice owner | Quarterly |
What Your Billing Partner Should Report
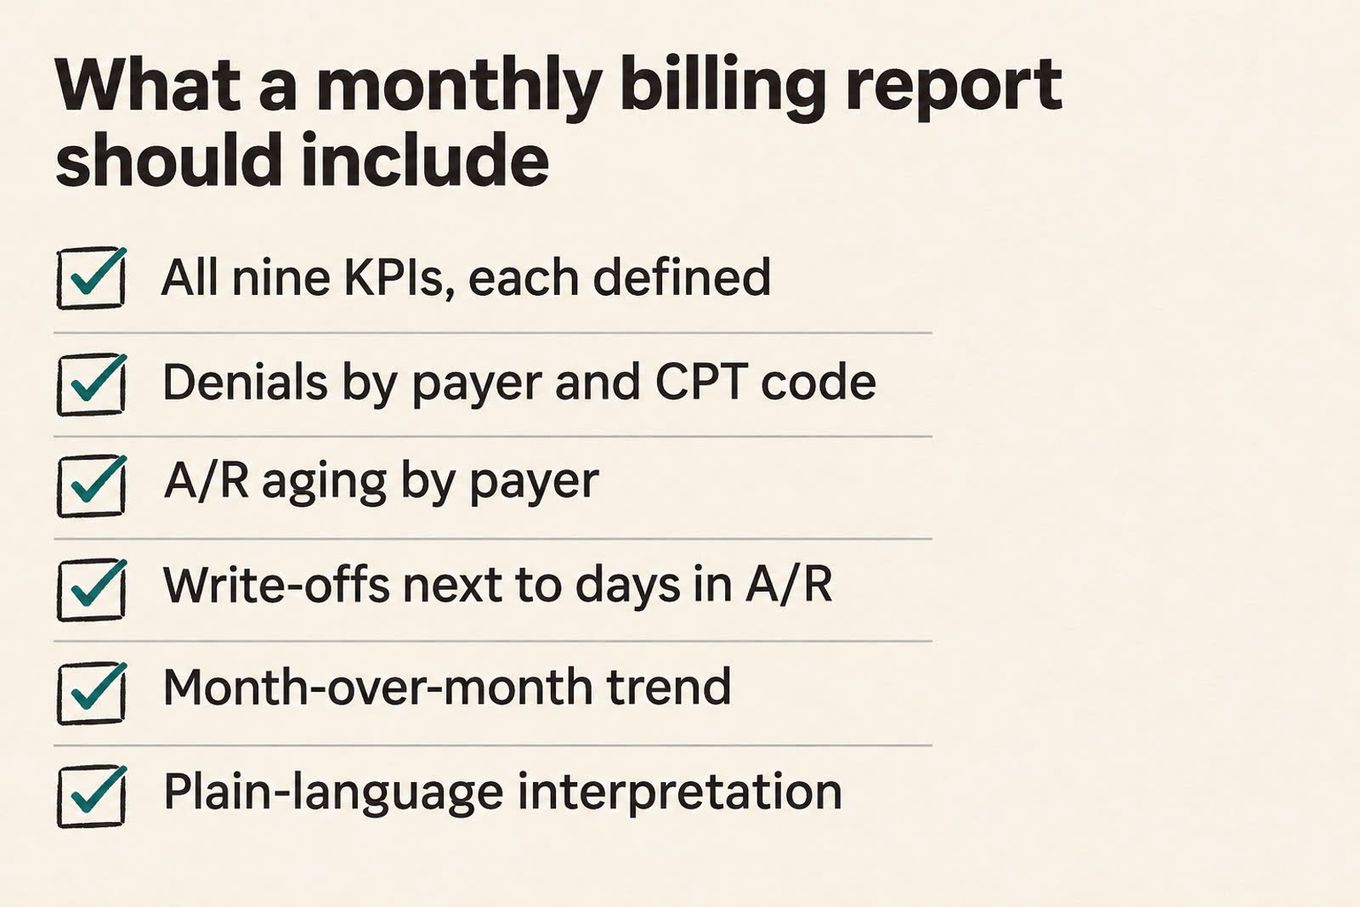
If billing is outsourced, the monthly report is the only window you have. A report worth keeping includes:
- All nine KPIs above, each with a written definition
- Denial rate by payer and by CPT code, with reason codes
- A/R aging by payer, in standard buckets
- First-pass resolution alongside clean claim rate
- Write-off rate next to days in A/R
- Month-over-month trend, not just the current figure
- Cuts by payer, provider, code, and location
- Written interpretation of what changed and who is acting on it
- A named person who can explain any number that moved
A report with no interpretation attached is data, not reporting. If a vendor cannot or will not provide these, that is useful information in itself. Our guide to questions to ask before hiring a medical billing company covers more of what to request.
Why Trust This Article
We built this scorecard from the standard definitions published by HFMA (MAP Keys) and MGMA, then compared them against benchmarks from a Conifer Health Solutions white paper, a Maryland public health billing manual, and physician-practice and behavioral health publishers. We also checked each figure against the metrics we document in our own guides on denial management, accounts receivable management, and revenue cycle management services. Where sources disagree, we show the range and say why.
Clarity's team brings more than 40 years of combined revenue cycle experience across physician practices, behavioral health organizations, specialty providers, and multi-location groups. President and CEO Estelle Sandoval has led billing operations for practices and physician groups since the late 1980s. In one behavioral health (IOP/PHP) engagement featured on our results page, the denial rate fell from 22% to 6% and A/R over 90 days fell from 38% to 11%. Client case studies are anonymized, and references are available on request.
This article is informational guidance for practice operations. It is not billing, coding, legal, or financial advice for your specific situation.
How Clarity Can Help
Tracking nine KPIs is the easy part. Acting on them every month is where most practices stall.
Clarity's KPI & Payment Analytics service provides reporting and dashboards on the metrics leadership watches most closely: denial rate by payer and code, days in A/R with aging buckets, and net collection rate. For clients who use us end to end, that comes as one monthly report from one accountable team, so the person explaining the number is the same person fixing it.
If you want to see how your current numbers compare, you can request a free revenue review. We review your denials and accounts receivable and reply within one business day with an estimate of what can be recovered.
Frequently Asked Questions
What are the most important KPIs in medical billing?
The most important KPIs in medical billing are clean claim rate, denial rate, days in A/R, net collection rate, and cost to collect. Clean claim rate and denial rate show how well claims are built and accepted, while days in A/R and net collection rate show how quickly and completely you are paid. Tracking all four together prevents one good number from hiding a problem.
What is a good days in A/R for a medical practice?
Most practices target under 40 days in A/R, and 30 to 35 days or lower is generally considered high-performing. Published sources vary: one white paper lists 30 to 40 days as optimal, and a Maryland billing manual says top performers run under 35 days. Check A/R over 90 days alongside it, because an average can hide old balances.
What is a good clean claim rate?
A clean claim rate of 95% or higher is a common working target, though published benchmarks range from above 90% to 98%. A rate below 90% is widely treated as a warning sign of front-end problems such as eligibility errors, missing authorizations, or coding edits. Clean claim rate is a leading indicator, so changes show up before denials and A/R do.
What is the difference between net collection rate and gross collection rate?
Gross collection rate is commonly calculated as payments divided by total billed charges, so it moves whenever your fee schedule changes and is best used for trending. Net collection rate divides payments by charges minus contractual adjustments, so it measures how much of the collectible amount you actually received. Net collection rate is the better measure of billing performance, with a common target of 95% or higher.
How often should a practice review its billing KPIs?
Review leading indicators such as clean claim rate, first-pass resolution, and charge lag weekly, because they let you correct problems before revenue is lost. Review lagging indicators such as days in A/R, net collection rate, and write-off rate monthly. Measure net collection rate over a rolling 12 months, since a single month is too volatile to trust.
What is a good denial rate in medical billing?
A denial rate below 5% is the common best-practice target, and rates above 10% signal a systemic problem in front-end eligibility, coding accuracy, or timely filing. Reported industry averages run higher than the target, from about 5% to 10% in one white paper to around 11% to 12% in another guide. Break the rate down by payer, CPT code, and reason code to find where the denials actually come from.