
Patient collection rates can fall as low as 34%, and once a balance climbs above $7,500, the probability of collecting drops below 17% (source data on patient collection performance). That's not a back-office nuisance, it's a direct hit to cash flow, margin, and the organization's ability to fund care. Hospital revenue cycle analytics exists to find those leaks early, show where they start, and make the fixes visible enough for leadership to act on them.
For CFOs and hospital finance leaders, the point isn't more dashboards. The point is getting a clear answer to a simple question, where is revenue slipping away, and what should we do first? In a complex billing environment, the right analytics program connects patient access, coding, claims, payment posting, and collections into one financial story.
Table of Contents
- Moving Beyond Reports to Revenue Intelligence
- Why RCM Analytics Is Your Financial Command Center
- The Key Performance Indicators That Actually Matter
- Architecting Your Hospital's Analytics Framework
- A Phased Roadmap to Analytics Maturity
- Common Pitfalls and How to Avoid Them
- From Data Points to Strategic Decisions
Moving Beyond Reports to Revenue Intelligence
Hospitals have had reports for years. What many still lack is revenue intelligence, a system that tells leaders not just what happened, but where to intervene before the problem repeats. That difference matters because the revenue cycle is full of small failures that look isolated on paper, then compound into slower cash, more rework, and avoidable bad debt.
HFMA's MAP Keys brought structure to that chaos by formalizing 29 KPIs across 5 major categories, including Patient Access, Pre-Billing, Claims, Account Resolution, and Financial Management (HFMA MAP Keys). The value of that framework is simple, it gives hospitals a common language for comparing performance across registration, coding, claims, payment posting, and collections instead of arguing over disconnected internal reports.
Why the old model falls short
Traditional reporting usually sits in silos. A patient access manager sees registration errors, a billing manager sees denials, and finance sees cash lag, but nobody owns the chain that connects them. That's why a true analytics approach has to trace the revenue cycle from front-end activity to final collection.
Practical rule: if a metric doesn't help a leader decide where to fix a workflow, it's reporting, not analytics.
The business case is already visible in the benchmarks. Net collection rate above 95% is commonly treated as excellent, while bad debt is often benchmarked around 2–3% of net patient revenue (revenue cycle metrics benchmark context). Those are not abstract finance targets. They define how much cash the organization keeps after care is delivered.
A strong analytics program also helps hospital leaders distinguish between a process problem and a payer problem. That's critical because not every lost dollar comes from staff error. Some losses start at the front desk, some in coding, and some in contract variance. The right lens separates those causes instead of flattening everything into one denial report.
Why RCM Analytics Is Your Financial Command Center
Think of hospital revenue cycle analytics as a financial MRI. A standard report shows surface-level symptoms, but analytics shows where the blockage is, whether it's eligibility, charge capture, denial patterns, or underpayment. That's why it belongs in the CFO's command center, not just in the billing department.
A hospital finance team can't steer on gut feel when cash timing depends on payer behavior, patient responsibility, and operational discipline across multiple departments. HFMA's patient access guidance makes that point directly, organizations should analyze eligibility, registration, and consumer/insurance effectiveness across facilities because those upstream processes drive downstream denials and cash-flow problems (HFMA patient access guidance). A key advantage of analytics is that it lets executives see the cause before the cash delay shows up in month-end results.
Front-end problems become back-end losses
The front end often looks administrative, but it is financially decisive. HFMA sets an overall insurance verification target of ≥98% of scheduled/pre-registered patients (HFMA RCM guidance). Missed verification doesn't stay localized. It turns into self-pay rework, denials, and collectible bad debt later in the cycle.
That's why the best analytics programs don't isolate registration from claims. They connect them.
A denial is often a late signal. The root cause was sitting upstream weeks earlier.
For leaders, that connection changes planning. Cash forecasting gets more credible when front-end performance is visible by payer, channel, and facility. Payer negotiations become sharper when the team can show where underperformance starts. Capital planning gets safer when executives can see whether margin pressure is a process issue or a contract issue.
The internal view of net collection rate can also sharpen this command-center mindset, and a practical reference point for that metric is available in Clarity's overview of collection performance at net collection rate benchmarking. Used correctly, the metric isn't just a score. It's a warning light.
What the command center should answer
A mature RCM analytics function should answer questions like these without hand-building spreadsheets:
- Where is cash slowing first? Identify whether the drag starts in access, claims, or follow-up.
- Which payer patterns repeat? Separate policy-driven denials from avoidable internal errors.
- Which patient balances are least collectible? Focus effort where collections are still realistic.
That's the shift from passive reporting to active control. Finance leaders stop reacting to revenue loss after it lands, and start managing the conditions that create it.
The Key Performance Indicators That Actually Matter
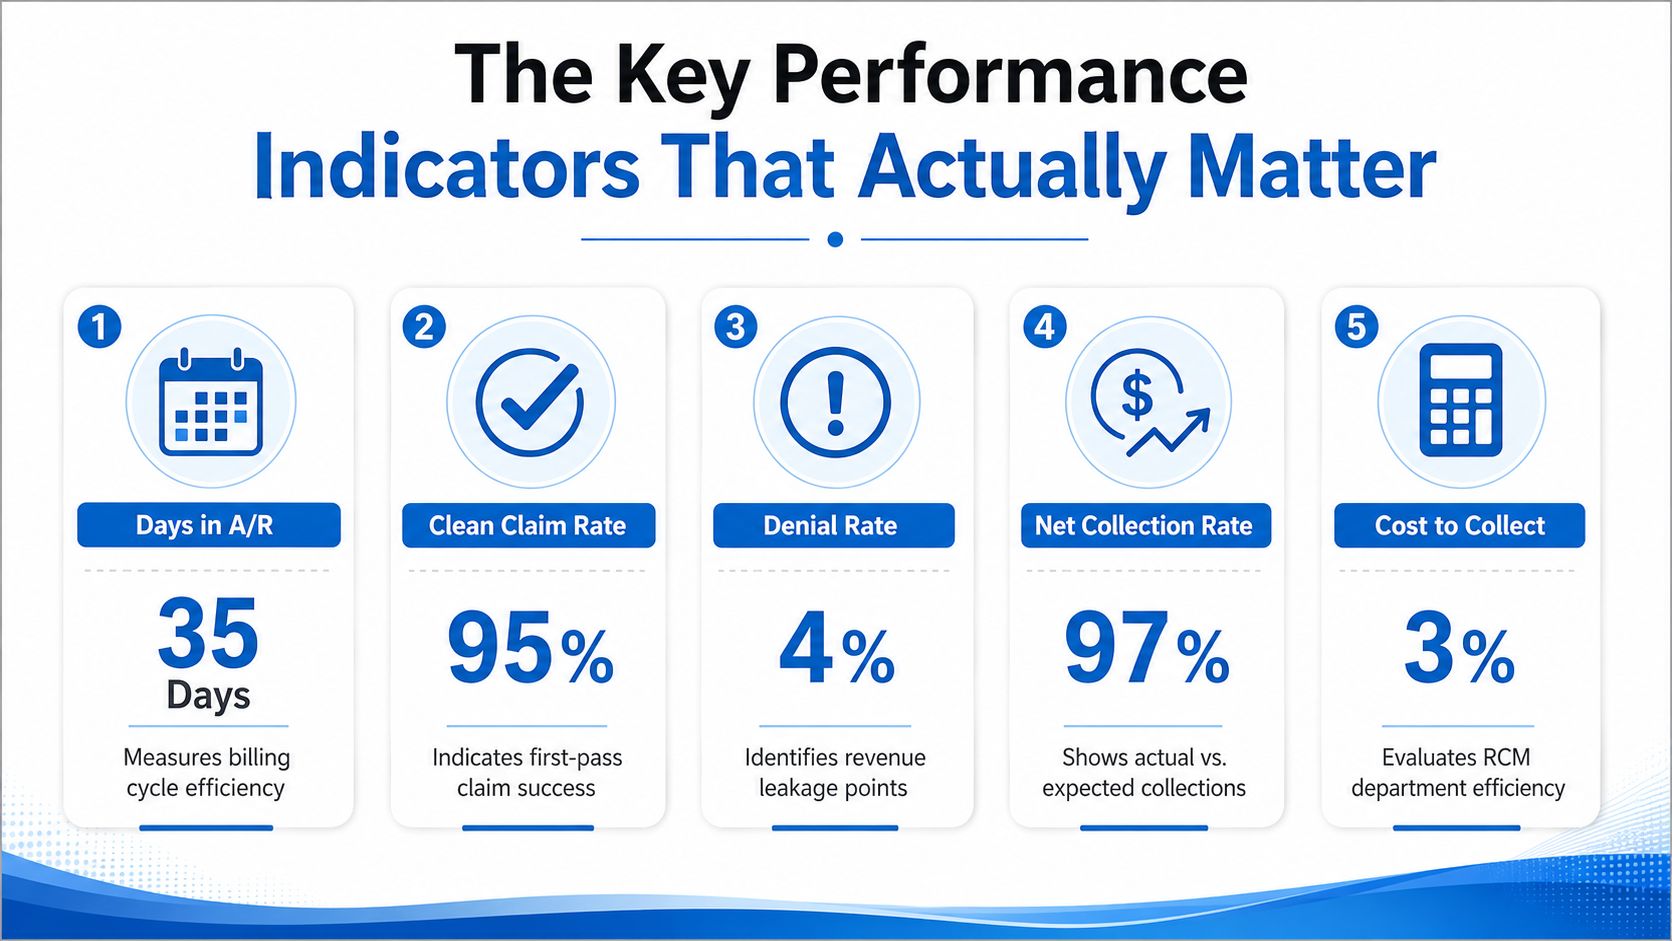
The cleanest KPI set is usually the one that maps directly to cash. HFMA's MAP Keys framework gives hospitals that structure with 29 KPIs across 5 categories, which is useful because no single metric tells the whole story (HFMA MAP Keys). A CFO needs a handful of measures that show whether the cycle is converting care into cash efficiently.
The scorecard that deserves leadership attention
Clean claim rate belongs near the top because it shows whether claims are getting out the door in usable form. Recent industry benchmarking for 2026 defines strong performance as 95%+ clean claim rate (benchmark context). If that number slips, cash slows and rework rises.
Denial rate is the second obvious metric, and strong performance is defined as under 5% in the same benchmark set (benchmark context). A rising denial rate is not just a billing issue. It often signals upstream registration, authorization, or coding problems that can be segmented by payer and service line.
Days in A/R matters because it reveals how long revenue is trapped before collection. The same benchmark set places strong performance at 35 days or fewer in net days in A/R (benchmark context). When A/R stretches, the organization carries more working capital burden and more follow-up labor.
How to read the metrics together
A strong-looking claim rate with weak cash collections usually means the cycle is leaking later, not earlier. A low denial rate with poor A/R aging may point to slow payer adjudication or weak follow-up discipline. And a solid collection rate can still hide trouble if patient balances are accumulating beyond what households can realistically pay.
The practical move is to segment each KPI by payer, service line, and denial reason. That lets leaders separate coding edits from eligibility failures and spot whether the issue is process, payer behavior, or both. The analysis is more useful when it identifies the mechanism behind the number, not just the number itself.
A compact leadership lens
- Clean claims tell you whether the billing engine is producing correct work.
- Denials show where friction is entering the cycle.
- A/R days show how long that friction is costing the hospital in cash timing.
- Collection rates show how much of expected revenue is being realized.
- Front-end verification shows whether the cycle started cleanly enough to support the rest of the process.
That's the scorecard. Everything else should support these questions, not distract from them.
Architecting Your Hospital's Analytics Framework
A useful analytics stack starts with the data the hospital already has, then turns it into something finance leaders can trust. The main sources are familiar, EHR, practice management, clearinghouse data, payer portals, and payment posting files. The difference is whether those inputs stay fragmented or get unified into one operational view.
From silos to a single source of truth
Hospitals rarely struggle because they lack data. They struggle because different teams define the same event differently, and the reporting layer never reconciles it. A working analytics architecture needs a single source of truth for claims, collections, denials, and access activity so finance and operations aren't debating whose spreadsheet is right.
That matters even more at the front end. If eligibility checks are scattered across scheduling systems, batch files, and manual workqueues, the organization can't tell whether verification gaps are tied to a location, a payer, or a workflow. That's why analytics has to include source-level visibility, not just total numbers.
The architecture that supports executive use
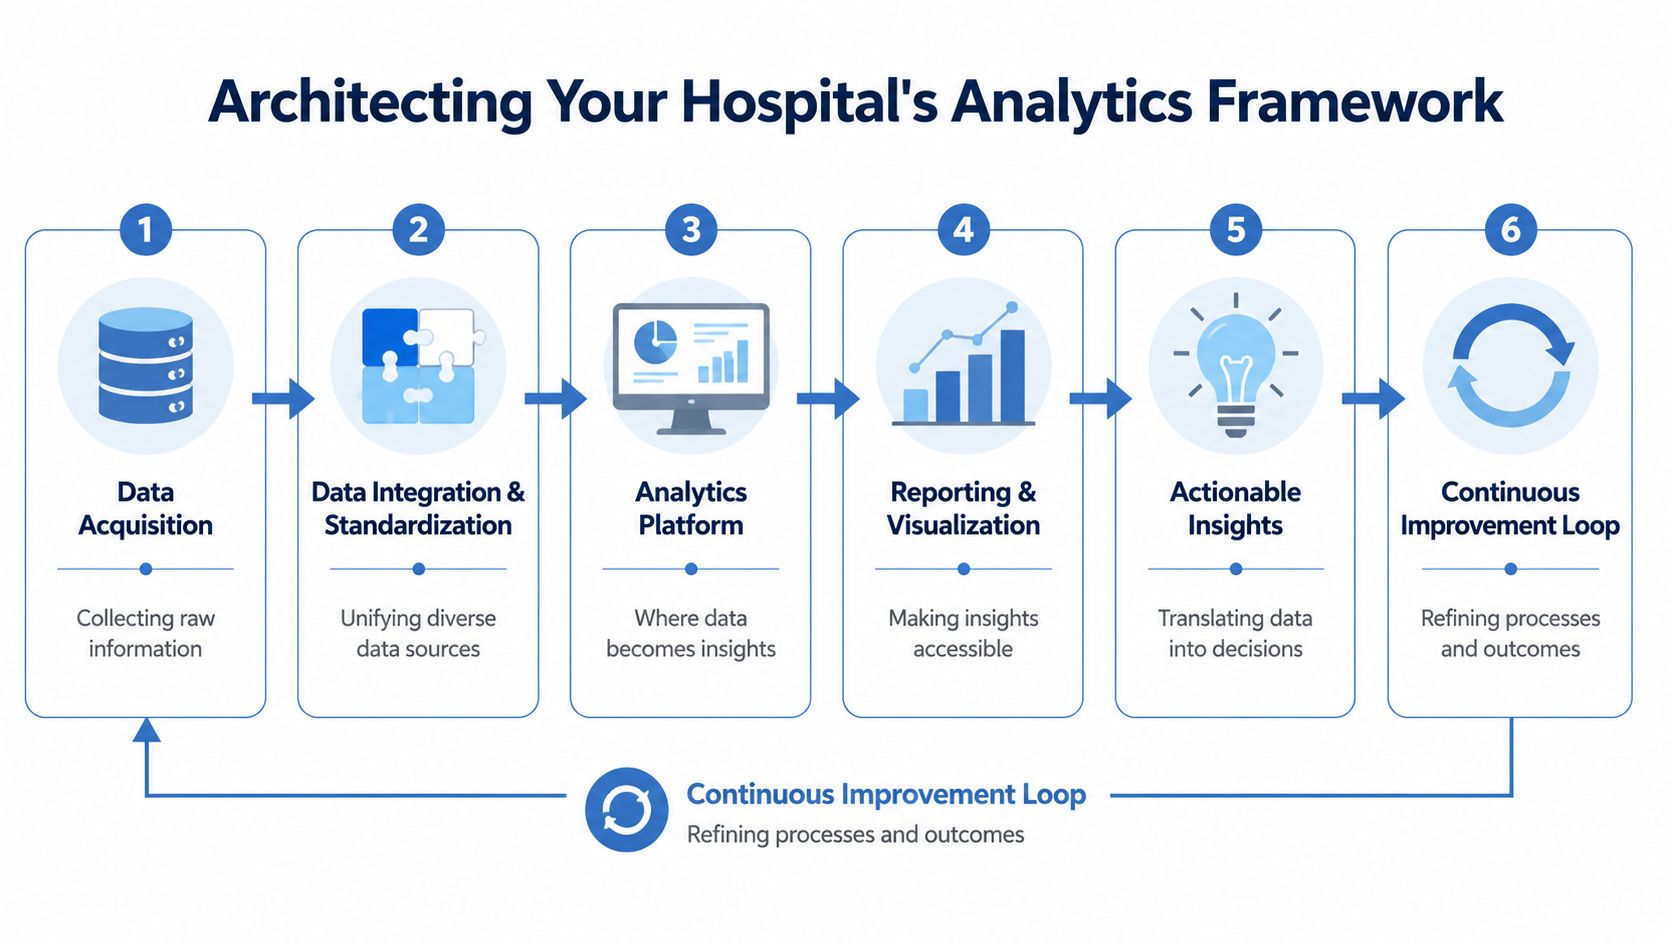
A practical executive architecture has four layers. Data sources feed a warehouse or integrated repository. That layer supports the business intelligence and analytics layer, which then feeds executive dashboards and exception reports. The design goal is not technical elegance, it's trustworthy visibility.
For leaders, the hard part is governance. Someone has to own metric definitions, refresh timing, and data quality checks. Without that discipline, dashboards become argument generators instead of decision tools.
Operational insight: the best dashboard is the one finance can use in a meeting without asking engineering to re-run the numbers.
For organizations evaluating tools, Clarity's healthcare revenue cycle management software page at healthcare RCM software is one example of how vendors position this layer around billing, verification, and posting workflows. The more important question is whether the platform can unify operational data well enough to support root-cause analysis.
What to expect from the framework
- Data acquisition should capture the transaction history cleanly.
- Standardization should make the same metric mean the same thing everywhere.
- Dashboards should show both trends and exceptions.
- Action layers should route leaders to the workflow owner who can fix the issue.
If any layer is weak, the whole program becomes less reliable. That's why the architecture has to be treated as a financial control system, not just an IT project.
A Phased Roadmap to Analytics Maturity
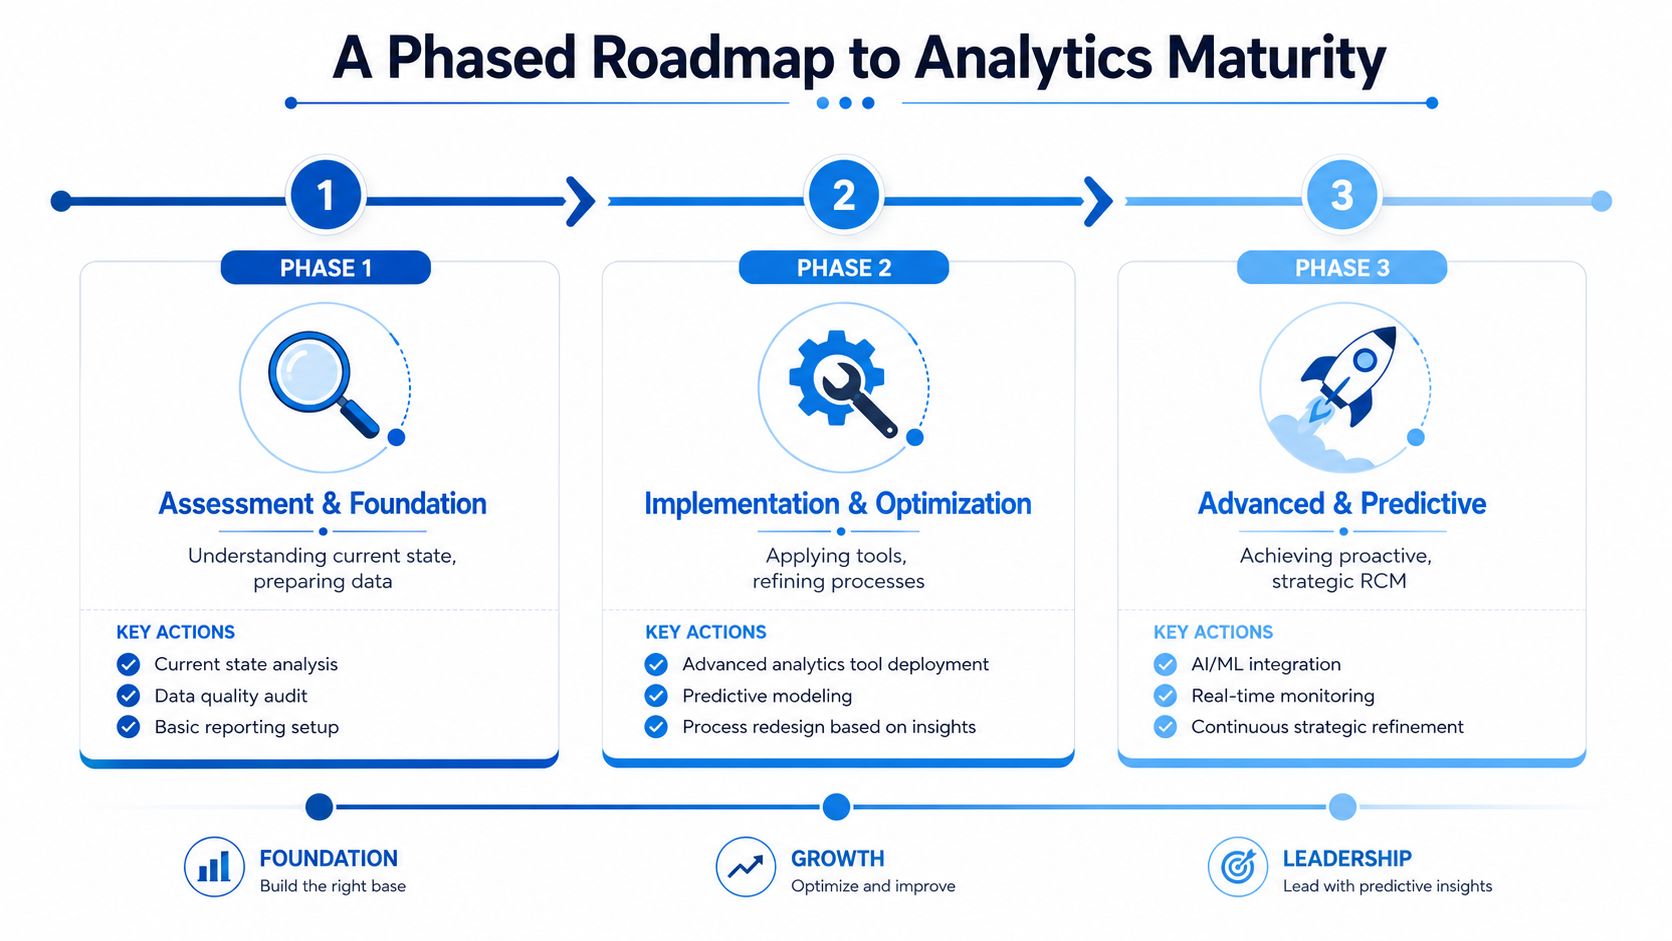
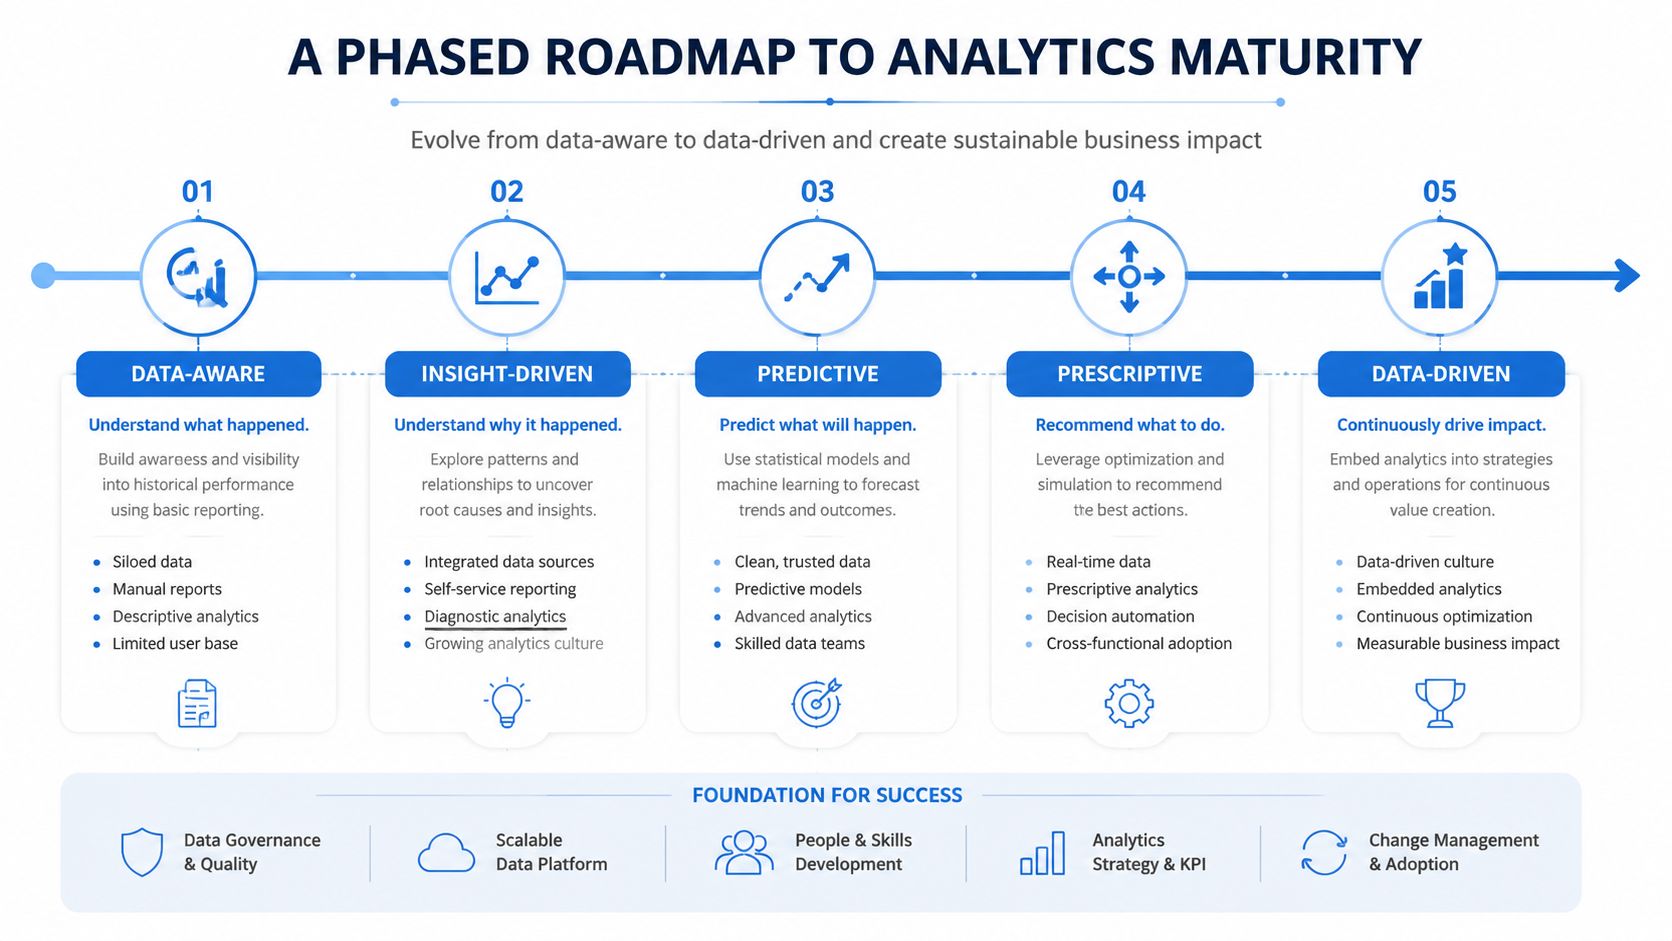
The fastest way to stall an analytics program is to try to do everything at once. Hospitals get farther by sequencing the work, starting with visibility, then moving into diagnosis, then into prediction. That approach also makes ROI easier to prove because each phase produces something usable.
Phase 1 builds the baseline
The first phase is about getting the facts straight. Leaders need baseline reporting on core KPIs, a clear definition of each metric, and a data quality audit so the team knows where the numbers are trustworthy and where they aren't. This is also the stage where the organization decides which pain points matter most, usually denials, A/R aging, patient collections, and front-end verification.
The goal here is not sophistication. It's consistency. Once the baseline exists, every later improvement can be measured against it.
Phase 2 turns reporting into diagnosis
The second phase is where the team starts asking why. Interactive dashboards, drill-down views, and trend segmentation let revenue cycle leaders see whether issues are tied to payer, location, service line, or denial reason. That's also the right time to use analytics for contract variance tracking and short-pay pattern review, because manual review of complex fee schedules stops scaling quickly (ThoughtSpot healthcare revenue cycle analytics guidance).
Workflow redesign becomes paramount. If the data shows repeated misses at registration or authorization, the answer isn't more reporting. It's a process change tied to the visible failure point.
Phase 3 makes the operation proactive
The final phase is about anticipation. The organization uses trend models, exception alerts, and payer behavior analysis to detect problems earlier and allocate follow-up effort where it's most likely to pay off. That's also the level where contract leakage and underpayment detection become practical, not just aspirational.
As the program matures, leaders should review internal operating content like revenue cycle management trends alongside their own dashboards, because market changes often show up in workflows before they show up in month-end summaries. The ultimate payoff is not just better reporting. It's the ability to steer the cycle before the cash is already gone.
Common Pitfalls and How to Avoid Them
Most analytics failures don't come from bad software. They come from weak governance, low adoption, and poor process alignment. A hospital can buy a polished platform and still get poor financial results if the team doesn't trust the numbers or act on them.
The first trap is data quality. If eligibility, claims, and collections are defined differently across departments, the dashboard will keep producing arguments instead of insight. The fix is a metric owner, a written definition set, and a regular review process for source-system discrepancies.
The second trap is low adoption. Finance teams won't use dashboards that sit outside their daily workflow. The remedy is simple, put the views leaders need into the meetings they already attend, and make exceptions easy to investigate without bouncing between systems.
Process comes before technology
The third trap is assuming a tool can repair a broken process. It can't. If front-end verification is weak, if follow-up queues are unmanaged, or if denial work is inconsistent, the software only makes the problem more visible.
The patient collection data makes this especially clear. When overall collection rates can be as low as 34%, and the probability of collecting falls below 17% on balances over $7,500, weak processes show up as real revenue loss, not just reporting noise (patient collection metrics). That's why leaders have to fix the workflow, not just monitor it.
Don't start with the dashboard. Start with the decision you want it to improve.
A final mistake is building too many metrics at once. The team gets buried under noise and loses focus on the few measures that directly affect cash. Better to track a smaller set well, then expand once the organization has disciplined review habits.
From Data Points to Strategic Decisions
Value of hospital revenue cycle analytics is that it turns revenue cycle work into executive decisions. It tells a CFO where cash is slowing, which workflows are leaking, and whether the problem sits in access, claims, collections, or payer behavior. That's a much stronger position than reacting after revenue has already aged out.
The strongest programs connect the front end to the back end. They show whether eligibility verification is complete, whether claims are clean, whether denials are concentrated in one payer or service line, and whether collections are realistic for the patient balance mix. The best use of the data is not scorekeeping, it's prioritization.
A CEO or CFO should be able to ask these questions and get a useful answer quickly:
- Which service line is creating the most avoidable denials, and what's the root cause?
- Where is patient responsibility least collectible, and how should that change our collection strategy?
- What does current A/R aging suggest about cash flow pressure over the next quarter?
Those are leadership questions, not billing questions. If your team can answer them cleanly, the revenue cycle stops being a cost center and starts functioning like a control tower for margin improvement.
A CTA for Clarity.
No responses yet