

You're looking at an A/R report that should be boring, and it isn't. Cash is coming in late, old balances are hanging around, and the same people who swear claims are “going out clean” can't explain why the days in accounts receivable number keeps drifting up. That's the moment to stop treating the metric like a scorecard and start using it like a diagnostic tool.
In healthcare, days in A/R is the clearest short-form view of how long your organization waits to turn work into cash. It reflects front-end registration quality, coding discipline, denial handling, payer behavior, and how hard your team works on patient balances. If you chase the number without understanding what's driving it, you can make the metric look better while weakening revenue.
Table of Contents
- When the A/R Report Tells You Something Is Wrong
- What Days in A/R Measures
- Benchmarks That Matter
- Why A/R Days Creep Up in the First Place
- A Prioritized Playbook to Reduce Days in A/R
- When Lower Is Not Always Better
- Monitoring Cadence and a One-Page Action Checklist
When the A/R Report Tells You Something Is Wrong
A practice administrator opens the monthly aging report and sees the same ugly pattern. Visits were steady. Claims were sent. The bank balance still feels thin. The billing team says they're “working the backlog,” but the oldest receivables keep sitting there like they belong to someone else.
That's the point where leaders need to stop asking, “Why is the number high?” and start asking, “What part of the revenue cycle is breaking?” Days in accounts receivable is useful precisely because it connects the whole chain. It doesn't care whether the problem started at check-in, in coding, at claim submission, or in patient collections, it shows that cash is taking too long to come home.
The metric is a management signal, not a decoration
A lot of teams treat days in A/R like a reporting vanity metric. That's a mistake. Cross-industry benchmark reporting summarized by Billed's accounts receivable statistics overview shows why the number matters operationally, top performers collect in 30 days or less, median performers collect in 38 days or less, and bottom performers are at 46 days or longer. The same benchmarking set also points to a $1.7 trillion working-capital opportunity among the top 1,000 U.S. public companies, with an 18-day DSO gap between top and median performers.
That spread is not academic. It tells you that collection speed changes the amount of cash you can use. In healthcare, where claims, denials, and patient balances all stretch out the cycle, a rising days in A/R number is often the first clean signal that the process is slowing down somewhere.
Practical rule: If the A/R report is getting worse and nobody can tie it to one operational cause, assume the problem is broader than one payer or one biller.
A useful way to think about it is simple. Every extra day in A/R is another day your organization is financing its own work. That's why strong leaders don't just review the metric, they interrogate it.
What Days in A/R Measures
A practice with days in accounts receivable under control turns billed work into cash without letting balances sit around. A practice with a rising number is not collecting fast enough, and that slows payroll, supply orders, technology spending, and debt service. The longer receivables linger, the more cash gets trapped in open claims and patient balances.
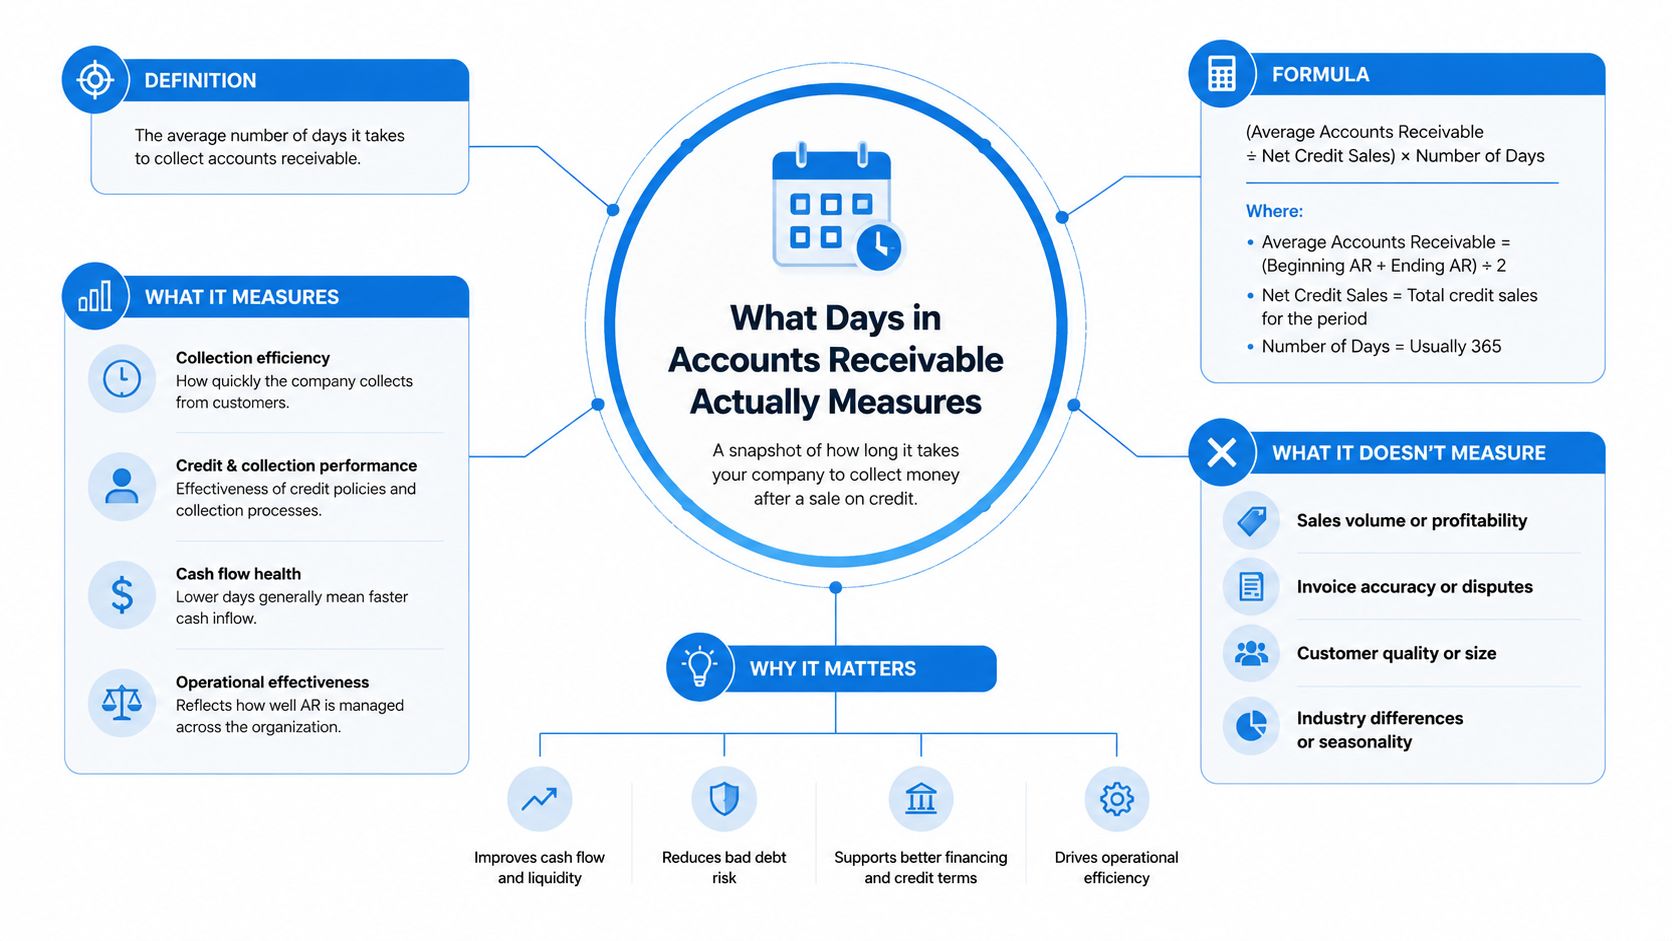
The formula is direct. In general finance, Accounts Receivable ÷ Average Daily Sales gives the number, or (Accounts Receivable ÷ Total Revenue) × 365. In healthcare revenue cycle management, the metric is usually written as Total Accounts Receivable ÷ Average Daily Charges. That healthcare version is often calculated from a trailing period, commonly 90 days or 6 months, because a trailing 90-day window smooths seasonal volume swings and makes comparisons across periods cleaner, according to MedPrecision Billing's formula guide.
A simple way to calculate it
Use the version that matches the setting, and keep the math consistent. In a general finance setting, divide total receivables by average daily sales. In a healthcare practice, divide total receivables by average daily charges. Either way, the result shows the average number of days cash stays stuck.
Here's the working example. If a practice has $360,000 in accounts receivable and $12,000 in average daily charges, the result is 30 days. The size of the practice does not change the logic. What matters is the relationship between open AR and daily production. If receivables rise faster than daily charges, the metric climbs.
Why the trailing window matters
A trailing 90-day period is useful because it keeps one soft month from creating false alarm bells. That matters in healthcare, where visit volume and payer mix move around from month to month. A short window can exaggerate noise. A longer one can hide a real collection problem.
The number matters only if you know what fed it.
Use the metric as a cash-flow speedometer, not a verdict. The headline number matters, but the denominator and the aging buckets behind it matter more. If the total looks bad, the first question is whether the issue is operational, or whether the practice is dealing with a payer mix shift, a heavier patient responsibility load, or both. For a useful cost-to-collect benchmark in that same context, review Clarity Health RCM's revenue cycle benchmark resource.
Benchmarks That Matter
Benchmarks only help when they tell you what kind of problem you are staring at. In healthcare, 35 to 40 days is the usual healthy range, with 35 days often used as a median for better-performing practices and above 60 days tied to the worst-performing quartile, as noted in HighRadius' healthcare A/R guidance. Under 30 days is strong performance. Above 60 days usually means the practice has a real bottleneck, not normal payer lag.
Use that range as a diagnostic, not a trophy. A number in the low 30s usually points to tight claim flow and steady follow-up. A number in the 40s deserves a closer look. A number above 60 should trigger a cleanup project, not a polite reminder to the billing team.
| Performance Band | Days in A/R | Typical Signal |
|---|---|---|
| Best-in-class | Under 30 | Tight workflow, fast cash conversion |
| Strong performer | 30 to 40 | Healthy cycle with manageable friction |
| Watch zone | 40 to 60 | Bottlenecks, rework, or payer mix pressure |
| High risk | Above 60 | Serious delay in claims or collections |
Cross-industry context still matters
Cross-industry benchmark reporting summarized in APQC and CFO.com coverage summarized here tells the same story in broader terms. Top performers collect in 30 days or less, median performers in 38 days or less, and bottom performers in 46 days or longer. That is a useful anchor for healthcare leaders because it shows how quickly working capital improves when collections are disciplined.
If your practice sits well above the healthcare median, stop explaining it away with industry noise. Benchmarking is not about finding a number that flatters you. It is about deciding whether the problem is inside the workflow or inside the business mix.
Use this cost-to-collect and benchmark framework as the next check. It helps you compare the headline A/R number against the work and cost required to collect it.
Why A/R Days Creep Up in the First Place
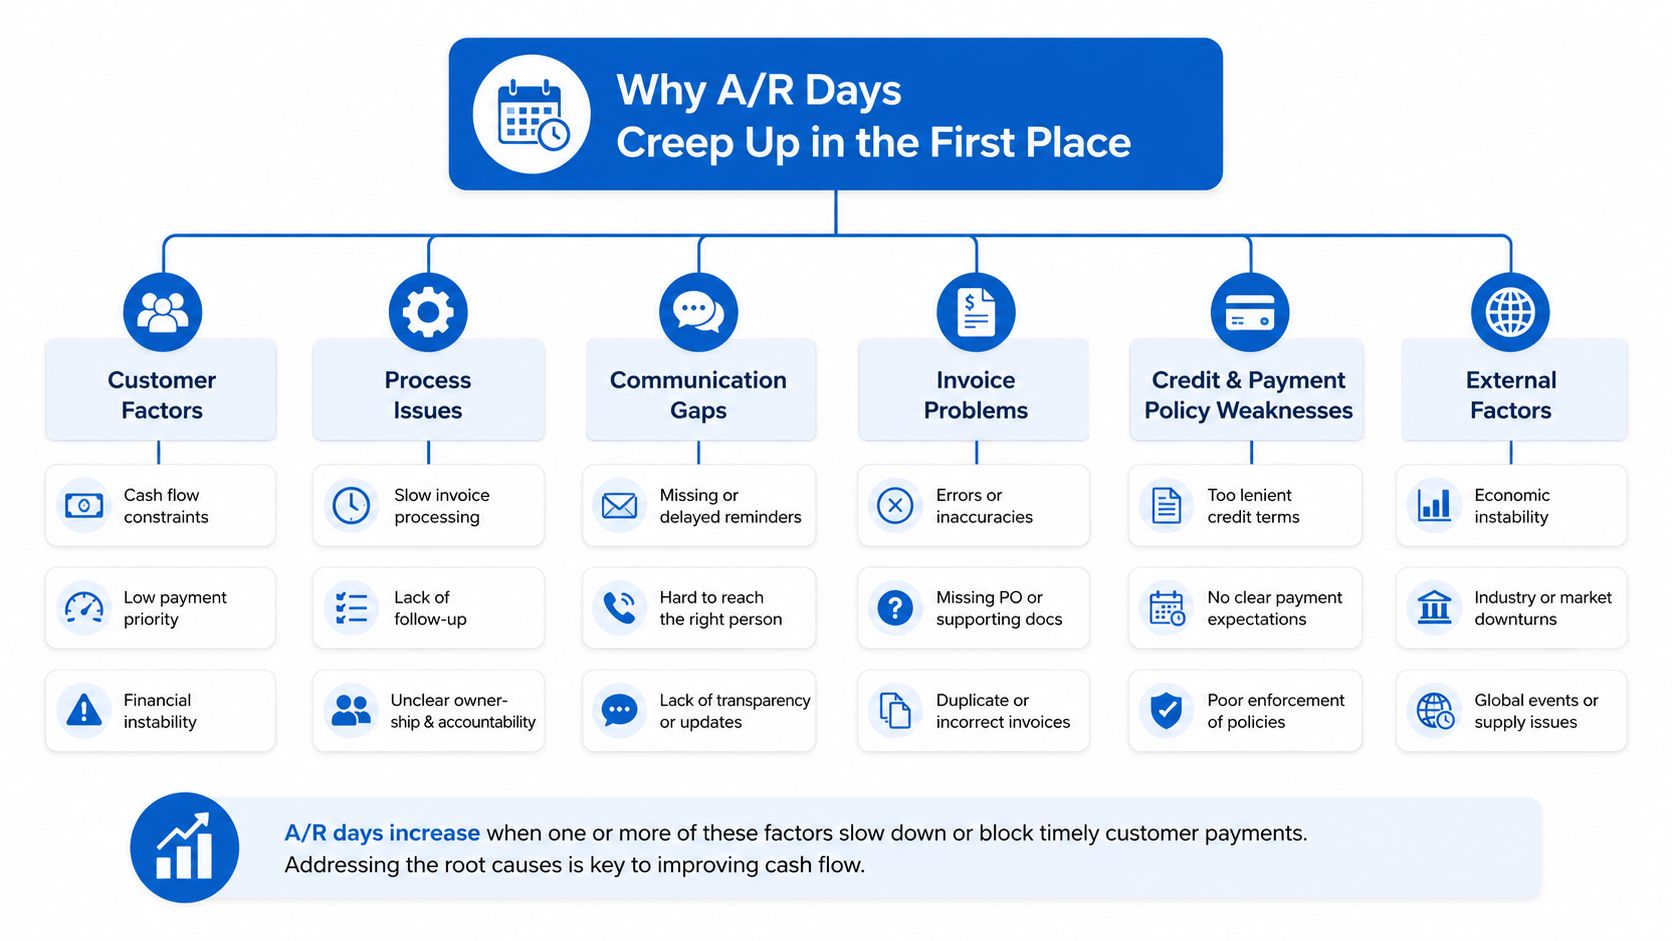
High days in A/R usually comes from two different worlds, and teams confuse them constantly. One world is operational failure. The other is structural change. If you don't separate them, you'll waste time fixing the wrong problem.
Operational failures are fixable
Incomplete eligibility checks create avoidable denials before the visit is even over. Under-coded claims leave money on the table and slow the clean-up work later. Delayed payment posting makes the AR picture look worse than it is, while unresolved denials sit in limbo until someone finally works them.
Those are process problems. They need discipline, ownership, and follow-through. If the team is not checking benefits up front, not submitting claims promptly, or not attacking denials with a deadline, the metric will climb even in a stable payer environment.
Structural shifts change the math
The harder issue is when the business itself changes. More patient responsibility after insurance adjudication means more balances move into self-pay. A different payer mix can slow reimbursement even when staff performance is unchanged. A shift toward more complex services can also lengthen the cycle because more complex claims often need more back-and-forth.
That's why a rising days in A/R number does not always mean the billing team failed. It can also mean the practice now bills a different mix of work than it did six months ago. The job of finance leadership is to tell the difference.
Read the denominator before you blame the staff
A soft month of charges can push the metric up even when operations are steady. That's because the ratio reacts not only to open AR, but also to recent production. This is straight from the logic of the metric, as described in Allianz Trade's explanation of AR days, where the number rises when receivables accumulate faster than billed revenue or when collection lag widens.
That's why I want leaders to stop reacting to the headline alone. Split payer AR from patient AR. Break aging into buckets. Compare each trend against denials, charge lag, and cash posting timing. If you don't do that, you're guessing.
Diagnostic rule: If the metric rises while charge volume softens, don't call it a collection collapse until you've checked the production side.
A Prioritized Playbook to Reduce Days in A/R
The fastest way to lower days in A/R is to stop doing the slow, sloppy things that create delay in the first place. Not every fix deserves equal attention. Start where the cash leak is easiest to plug.
Start with the front end and claim velocity
Verify eligibility before every visit, not after the claim is rejected. That one habit reduces avoidable downstream work because billing staff aren't untangling coverage problems after the fact. Then push clean-claim submission within 48 hours. If claims are leaving the building late, the rest of the workflow is already behind.
Next, give denials a real turnaround standard. I'd use a 7-day internal SLA for denial follow-up, because anything slower becomes triage theater. Weekly ownership matters too. Someone should be assigned to the oldest items, not just the newest ones.
Attack the aging buckets that hurt most
The 90-plus bucket deserves weekly review. That's where weak follow-up and avoidable write-offs hide. The older the balance gets, the less likely it is to come back cleanly, which is why leaders need a standing sweep, not a once-a-month audit.
Tighter payment posting discipline matters as well. If the team posts payments late or inconsistently, the A/R report becomes unreliable, and unreliable reporting leads to weak decisions. Patient balance estimates at the time of service help too, because they reduce surprise balances later and make collection conversations less awkward.
Use automation where it removes repetition
Automated payment reminders are worth using when they support staff, not replace them. They work best for routine patient balances and simple follow-up sequences. They are not a substitute for actual AR work on denied claims or underpayments.
The same is true for front-desk retraining. It helps, but it is not the first lever I'd pull unless the intake team is clearly causing errors. Fix the highest-friction steps first, then clean up the smaller ones.
Review this AR recovery solutions page if you need a reference point for how structured follow-up gets organized in practice.
For teams that want a visual workflow, this embedded guide is useful.
Prioritize by impact, not by habit
A lot of practices spend too much time on low-yield cleanup work because it feels productive. It isn't. Put your best people on eligibility, claims, denials, and aged balances. Put lower-risk tasks behind them. That's how you get movement.
- Eligibility first: Verify coverage before the visit, every visit.
- Claims second: Submit clean claims within 48 hours.
- Denials third: Work denials within 7 days, with clear ownership.
- Aged balances fourth: Review the 90-plus bucket every week.
If your team can't tell you who owns the oldest balances by payer and by aging bucket, the playbook is already failing.
When Lower Is Not Always Better
A lower days in A/R number can look great and still mean the practice is underperforming. That's the part most generic advice skips. If leadership only rewards a lower metric, the billing team has an incentive to game the number instead of improve the revenue cycle.
Bad incentives produce bad behavior
Premature write-offs can make the metric look cleaner while cutting off recoverable revenue. Under-coding can speed reimbursement at the cost of legitimate payment. Delayed charge capture can also make the number appear better because the receivables balance is artificially smaller than it should be.
That's why I don't trust anyone who talks about lowering days in A/R as if it were the only goal. The right question is not merely whether the number fell. The question is whether it fell for a healthy reason.
Use a dashboard, not a single number
Recent healthcare RCM guidance increasingly pairs days in A/R with other indicators, which is the right instinct. Track the percentage of AR over 90 days, first-pass denial rate, charge lag, and clean claim rate alongside the headline metric, as noted in the OMNI MD discussion of A/R optimization tradeoffs. That combination tells you whether the practice is improving or just reshuffling pain.
A low number is only good when the rest of the cycle is healthy. If the 90-plus bucket is rising, or denials are getting worse, or charge lag is widening, then the headline improvement may be fake. Leaders need to be skeptical on purpose.
Hard truth: If the metric improves while revenue slips, you didn't fix the cycle, you edited the scoreboard.
That's the discipline finance requires. Not just faster cash, but better cash.
Monitoring Cadence and a One-Page Action Checklist
Good A/R management is repetitive by design. If the cadence is weak, the metric will drift before anyone notices. The goal is not a heroic cleanup once a year, it's a steady operating rhythm that keeps the numbers honest.
Set the reporting rhythm
Review A/R aging weekly with billing leadership. That meeting should focus on the oldest buckets, payer-specific outliers, and any balances stuck without action. Run denial trend analysis monthly so you can see whether a payer, service line, or workflow change is creating new friction.
Then step back quarterly and review payer mix and patient responsibility trends with finance leadership. That's where you catch structural changes before they turn into a false operations panic. The owner of each report should be clear, billing manager for the weekly review, revenue cycle lead for monthly trends, CFO or finance director for the quarterly view.
One-page action checklist
- Check eligibility before service: Make it standard, not optional.
- Track clean claim submission time: Claims should move fast enough that age doesn't pile up in the queue.
- Review denial aging weekly: Old denials need named ownership.
- Sweep the 90-plus bucket: Don't let aged balances survive on inertia.
- Separate payer AR from patient AR: They do not fail for the same reasons.
- Watch charge lag: A lower number can be fake if production is delayed.
- Compare trends, not just totals: Look at buckets, not only the headline.
- Assign escalation paths: Someone should know when a balance moves out of routine work.
A useful diagnostic platform makes this easier. ClarityOS revenue cycle analytics gives teams a single live view of collections, A/R, payer performance, and patient payments, which is exactly the kind of visibility leaders need when they're trying to separate operational failure from structural change.
When outside help makes sense
Bring in external support when the internal team can't isolate the cause, the aging buckets keep widening, or the practice lacks the reporting discipline to keep the work moving. That support should not just chase claims. It should show you where the cycle is slowing, what type of receivable is aging, and which fix will move cash.
If you're running a practice, a group, or a health system and the A/R report keeps telling the same bad story, stop treating it as background noise. Use the metric the way finance leaders should, as a signal to diagnose, prioritize, and act. If you want a partner that can map the aging problem, the payer mix, and the follow-up work into one operating view, visit Clarity and start with a revenue cycle review that gets specific about where your cash is getting stuck.
No responses yet