

Denied claims are rarely a back-office problem alone. By the time leadership sees cash slow down, the operational failure usually started much earlier, at registration, eligibility, prior authorization, or charge capture.
That is why medical billing performance metrics should be managed as operating controls, not monthly reporting. Practices that only watch A/R and collections miss the front-end breakdowns that drive a large share of preventable denials and force staff into expensive rework. In my experience, that is where leadership gets the fastest financial return, because fixing errors before claim submission costs far less than correcting them after rejection or denial.
The right scorecard has to cover both sides of the revenue cycle. Back-end measures still matter, especially collections and cash velocity, and practice leaders should understand how net collection rate affects true reimbursement performance. But a back-end view by itself is incomplete. A practice can post acceptable collection numbers for a quarter while front-end defects are building the next denial wave.
Strong revenue cycle management starts upstream. Teams that track scheduling accuracy, insurance verification, authorization completion, demographic error rates, charge lag, and clean claim performance get earlier warning, lower avoidable denials, and more predictable cash flow. That gives leadership a clearer view of financial health and a more practical path to improvement.
Table of Contents
- Why Your Practice's Financial Health Depends on These Metrics
- The Hidden Impact of Front-End Performance Metrics
- Tracking the Core Back-End Billing Metrics
- Decoding Your Claim Denial Rate
- How to Visualize Your Billing Performance
- Diagnosing the Root Causes of Poor Performance
- Strategic Steps to Improve Revenue Cycle Outcomes
Why Your Practice's Financial Health Depends on These Metrics
A practice can look busy and still leak revenue every day. Full schedules don't guarantee strong collections. Clean execution does.
The leadership issue is simple. If you don't track medical billing performance metrics consistently, you won't know whether the problem is poor registration, weak coding, slow claim follow-up, payer friction, or bad collection discipline. You'll just see cash arrive late and spend months reacting.
Three metrics shape financial stability more than most owners realize:
- Cash speed: A/R tells you how quickly work turns into money.
- Revenue capture: NCR shows whether collectible dollars are being collected.
- Claim quality: Clean claims indicate whether your team is producing billable work without preventable friction.
When these metrics drift, the operational consequences spread fast. Staff spend more time correcting claims. Supervisors chase exceptions instead of managing throughput. Providers hear that “billing is behind” without any clear explanation of why. The finance side feels it first, but the root problem usually sits in daily workflow.
Practical rule: If leadership only reviews production and deposits, leadership is flying blind. Revenue cycle performance has to be managed between charge entry and final payment.
The strongest organizations don't treat billing metrics as a billing department issue. They use them to manage accountability across registration, eligibility, coding, claim submission, payment posting, and follow-up. That's also why executives should understand measures like net collection rate in practical terms, not as a spreadsheet exercise but as a signal of revenue that should have been captured and wasn't.
A good dashboard won't fix a weak process on its own. But it will show you where to act before small inefficiencies become a cash flow problem.
The Hidden Impact of Front-End Performance Metrics
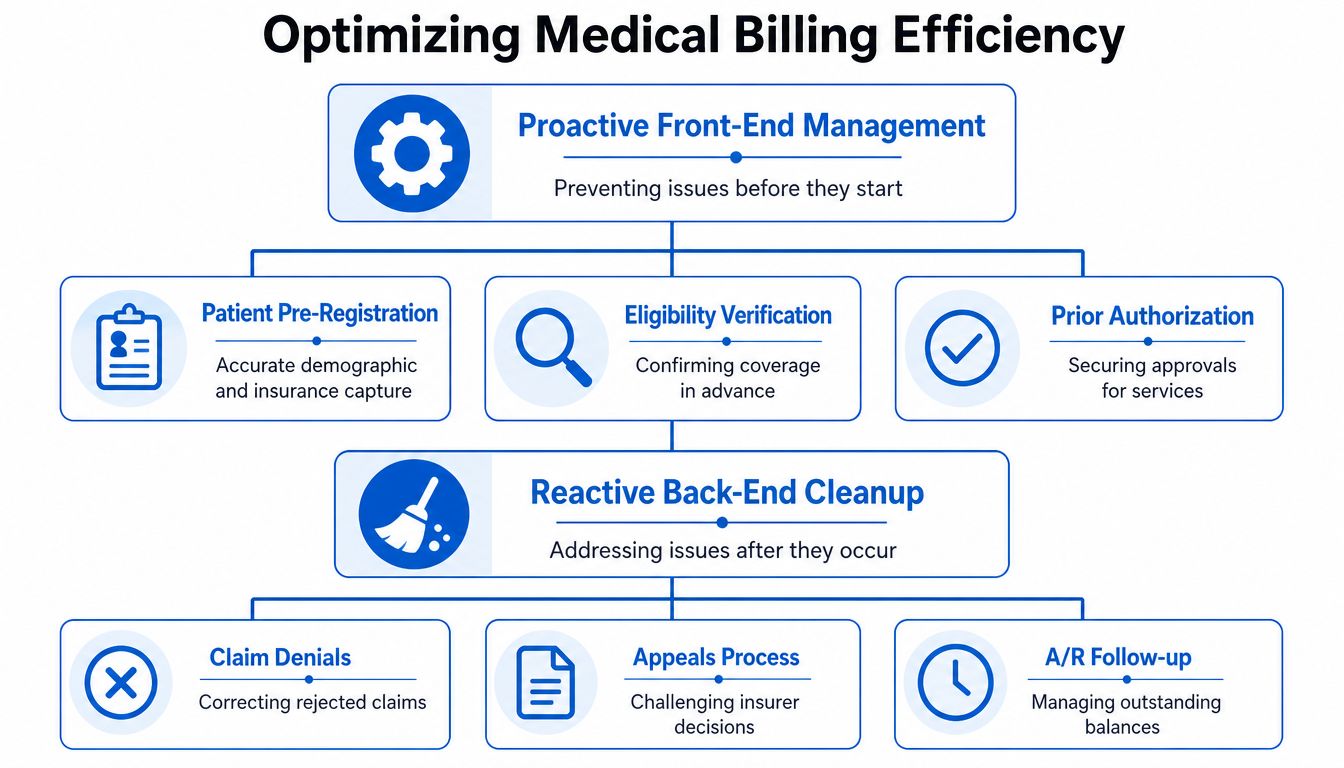
Most dashboards overemphasize the back end because that's where failure becomes visible. Denials appear there. A/R aging appears there. Collection shortfalls appear there. But many of those problems started at check-in, pre-registration, or eligibility verification.
Industry data shows that 60-70% of denials stem from front-end issues like poor eligibility verification or incorrect patient data, yet these metrics are rarely tracked, leaving a 30-40% blind spot in revenue cycle performance, according to Microwize's medical billing KPI analysis.
Front-end metrics prevent expensive downstream work
Back-end metrics tell you what happened. Front-end metrics tell you what's about to happen.
That distinction matters. If a patient's coverage isn't verified correctly, if demographic data is incomplete, or if authorization requirements are missed, the billing team inherits a broken claim before it ever reaches a payer. No amount of denial management sophistication makes that efficient.
The front-end measures worth leadership attention include:
- Registration accuracy rate: Are staff capturing names, dates of birth, policy information, and subscriber details correctly?
- Eligibility verification rate: Is coverage being confirmed before service, not after denial?
- Authorization completion rate: Are required approvals secured before high-risk encounters and procedures?
- Financial clearance consistency: Are staff identifying patient responsibility and coverage limits early enough to avoid avoidable billing friction?
What works and what doesn't
What works is simple, but it requires discipline. Practices that reduce denial pressure usually standardize intake scripts, hard-stop incomplete registrations, verify benefits before the visit, and train front-desk staff like revenue cycle contributors, not just reception staff.
What doesn't work is relying on the billing office to “catch it later.” By that point, the claim is delayed, the patient may be surprised by the bill, and the team is spending labor on rework instead of throughput.
Front-end performance is where you treat the cause. Back-end cleanup is where you pay for not treating it earlier.
Leadership should ask one uncomfortable question every month. Which front-end errors are repeatedly creating downstream denials, rework, and delayed cash? If no one can answer that clearly, the practice has a visibility problem, not just a billing problem.
Tracking the Core Back-End Billing Metrics
A practice can stay busy all month and still come up short on cash. Back-end billing metrics show whether charges are turning into payments on a reasonable timeline, whether collectible revenue is being recovered, and whether claims are leaving the door clean enough to avoid preventable rework.
These measures matter on their own. They matter more when leadership reads them alongside front-end performance. A weak clean claim rate, for example, is often a front-end problem showing up in a back-end report.
| Metric | Formula | Benchmark (Excellent) | Reporting Cadence |
|---|---|---|---|
| Days in A/R | Total AR / Average Daily Charges | 30 days or less | Monthly |
| Net Collection Rate | Payments collected relative to collectible revenue after contractual allowances | 95% or higher | Monthly |
| Clean Claim Rate | Clean Claims / Total Claims Submitted | 98% or higher | Weekly and monthly |
Days in Accounts Receivable
Days in A/R measures how long receivables sit before they convert to cash. The formula is simple. Total AR divided by Average Daily Charges. For leadership, this is a liquidity metric first and an operations metric second.
A practical benchmark looks like this:
- Excellent: 30 days or less
- Healthy: 30 to 40 days
- Red flag: over 50 days
Once A/R days start rising, cash gets tighter, old balances get harder to collect, and staff spend more time on follow-up that should not have been necessary. I usually tell physician owners to watch the aging mix with this metric, not just the headline number. Thirty-eight days in A/R with a heavy concentration in older buckets is a different problem than thirty-eight days with clean turnover.
Common causes are predictable. Claims are held for coding review. Payment posting falls behind. Follow-up queues age out. Payers delay resolution during the claim adjudication process. Front-end errors also show up here, especially when eligibility or authorization issues keep claims from moving on first pass.
Net Collection Rate
Net Collection Rate, or NCR, measures how much collectible revenue the practice recovered after contractual allowances are removed. It answers a harder question than gross collections. Did the organization collect what it had a right to collect?
Leadership should treat NCR as a leakage metric. If volume is stable and reimbursement terms have not changed, a drop in NCR usually points to execution problems, not market conditions.
A strong target is 95% or higher, with lower performance warranting a closer review of write-offs, denial recovery, patient balance follow-up, and payer underpayment controls.
The usual trouble spots include:
- Underworked denials: recoverable claims are never appealed or corrected
- Weak patient collections: insurance pays, but patient responsibility lingers
- Improper adjustments: balances are written off without clear support
- Contract variance gaps: underpayments are posted without review
NCR is useful because it exposes hidden loss. Charges may look healthy. Visit volume may look healthy. Cash still falls short when collectible dollars are missed in the back end.
Clean Claim Rate
Clean Claim Rate measures the share of claims submitted without errors that trigger rejection, delay, or manual rework. It is one of the best operating metrics in the revenue cycle because it connects accuracy to speed. Cleaner claims get paid faster and consume less labor.
A high clean claim rate usually signals discipline across the full workflow, not just in billing. Registration, eligibility, coding, documentation, and claim edits all affect this number. That is why leadership should not treat it as a billing-office-only KPI.
A strong target is 98% or higher.
When this metric drops, I would not start with the billing team alone. I would audit the first-pass workflow in order:
- Demographic accuracy
- Insurance and subscriber validation
- Authorization status for scheduled services
- Coding accuracy and modifier use
- Documentation completeness
- Timely claim submission
At this stage, the front-end and back-end view finally meet. A weak clean claim rate is often the financial footprint of earlier intake failures. Fixing those upstream controls prevents denials, reduces rework, and improves cash speed without adding more staff hours.
Decoding Your Claim Denial Rate
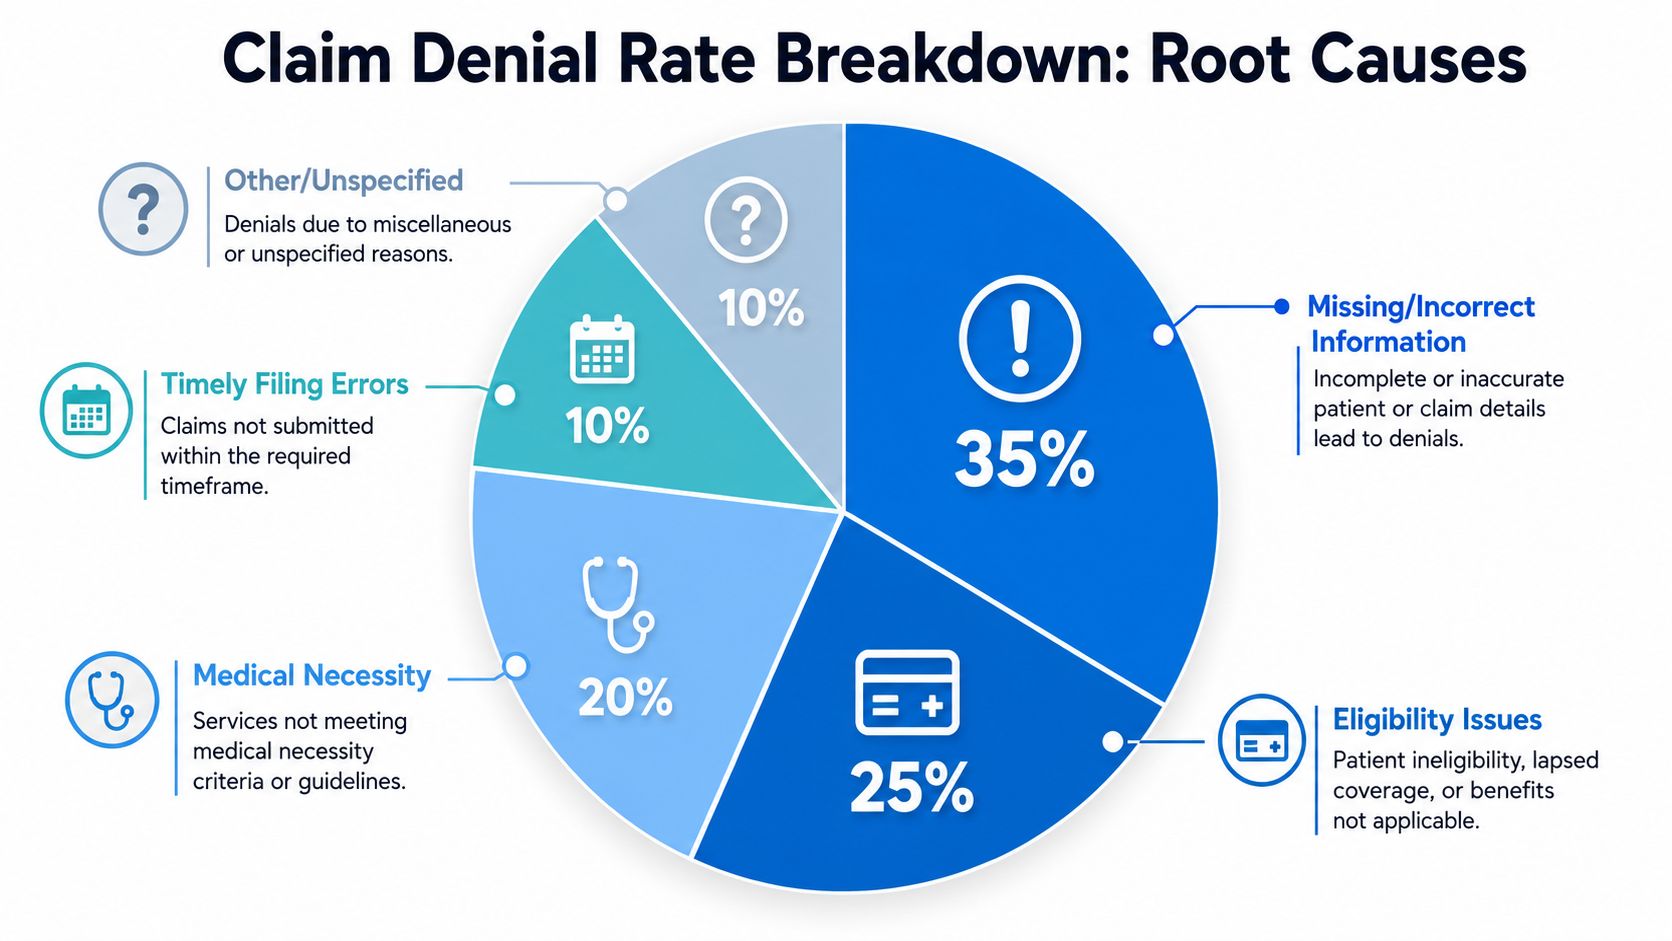
Denied claims can consume a meaningful share of collectible revenue, and the headline denial percentage rarely explains where the loss starts. Leadership needs a denial view that separates front-end process failure from payer or clinical complexity.
The industry benchmark was covered earlier. The decision that matters here is simpler. Split denials into two groups: preventable and complex.
What the denial rate tells you
Preventable denials usually start before the claim leaves the practice. Registration mistakes, missed eligibility checks, absent authorizations, coding errors, and filing delays all sit in this category. For many groups, this is the biggest opportunity because these denials are operational. They can be reduced with tighter intake controls, edit logic, staff accountability, and better work queues.
That front-end point gets missed too often. Many organizations review denials as a billing-office problem after the remittance arrives. By then, staff are paying for the same claim twice. Once to submit it, and again to rework it. Front-end discipline prevents a large share of denials before they ever hit A/R, which is why denial management should start at scheduling, registration, and pre-service verification.
Complex denials require a different response. Medical necessity disputes, policy interpretation issues, and payer adjudication decisions depend more on documentation quality, appeal strength, and payer-specific knowledge. If leadership groups these with preventable denials, the team usually applies the wrong fix and gets poor recovery rates.
Denials also change the meaning of your A/R numbers. As noted earlier, Days in A/R becomes less useful if denied balances sit unresolved in older buckets. The issue is not just aging. It is trapped cash, longer collection cycles, and more staff time tied up in follow-up.
A useful companion topic for leaders reviewing denial trends is understanding how claim adjudication works, because not every unpaid claim reached the same decision point for the same reason.
A short explainer helps teams align on the basics:
What to review every time denials rise
Start with the pattern, not the total rate.
- Denial category mix: Separate eligibility, authorization, registration, coding, medical necessity, and timely filing denials. A blended rate hides where the process is failing.
- Source by department: Identify where each denial originated. Front desk, pre-cert, coding, billing, and providers should have visible ownership.
- Aging of denied balances: Review how much denied A/R is rolling into older buckets. Old denials are less likely to convert to cash.
- Recovery rate by denial type: Measure how often the team overturns or corrects each category. Some denials need appeals. Others need workflow repair.
- Payer concentration: Check whether one payer, plan, or service line is driving the increase. That changes the response plan.
A denial rate without denial-category ownership is only an alarm. It does not tell leadership which team needs to fix what.
Practices improve this metric faster when denial meetings focus on repeated root causes, dollar impact, and accountable owners. Payer behavior matters, but many of the losses that hurt cash the most begin upstream, well before the claim reaches the back end.
How to Visualize Your Billing Performance
A good dashboard doesn't drown executives in data. It shows whether performance is improving, slipping, or stalling, and it makes those shifts visible early enough to act.
That means trend lines beat static snapshots. A single monthly number can look acceptable while the underlying direction is getting worse. What leadership needs is movement, exceptions, and operational links between cause and effect.

Build for trend visibility
A practical executive dashboard should separate what happened from why it happened.
One panel should track core financial outcomes such as A/R movement, collections, and denial patterns. Another should track operating inputs like registration accuracy, eligibility completion, claim edits, coding hold times, and follow-up backlog. When those sit side by side, the conversation gets sharper.
Here's the kind of narrative a useful dashboard should surface. If the eligibility verification rate slips this week, leadership should expect more preventable denials in the near term. If coding lag rises, claim submission slows and A/R pressure usually follows. If payment posting falls behind, collection visibility becomes unreliable even when payer performance hasn't changed.
Connect operational cause to financial effect
The best dashboards answer three leadership questions fast:
- Where are we off target right now
- Who owns the issue
- What downstream impact should we expect if it continues
That's why exception-based reporting matters. Don't make executives scroll through every metric every time. Flag outliers. Show payer-specific anomalies. Highlight workflow breaks that are likely to affect cash.
A dashboard should also support manager action, not just board review. Supervisors need enough detail to trace an issue from intake to claim to payment. That's where focused healthcare revenue cycle analytics capabilities become valuable. They turn scattered billing data into operating decisions leadership can use.
Strong visualization shortens the time between a process failure and a management response.
If your current reporting only shows month-end totals, it's too late for many corrections that could have protected cash.
Diagnosing the Root Causes of Poor Performance
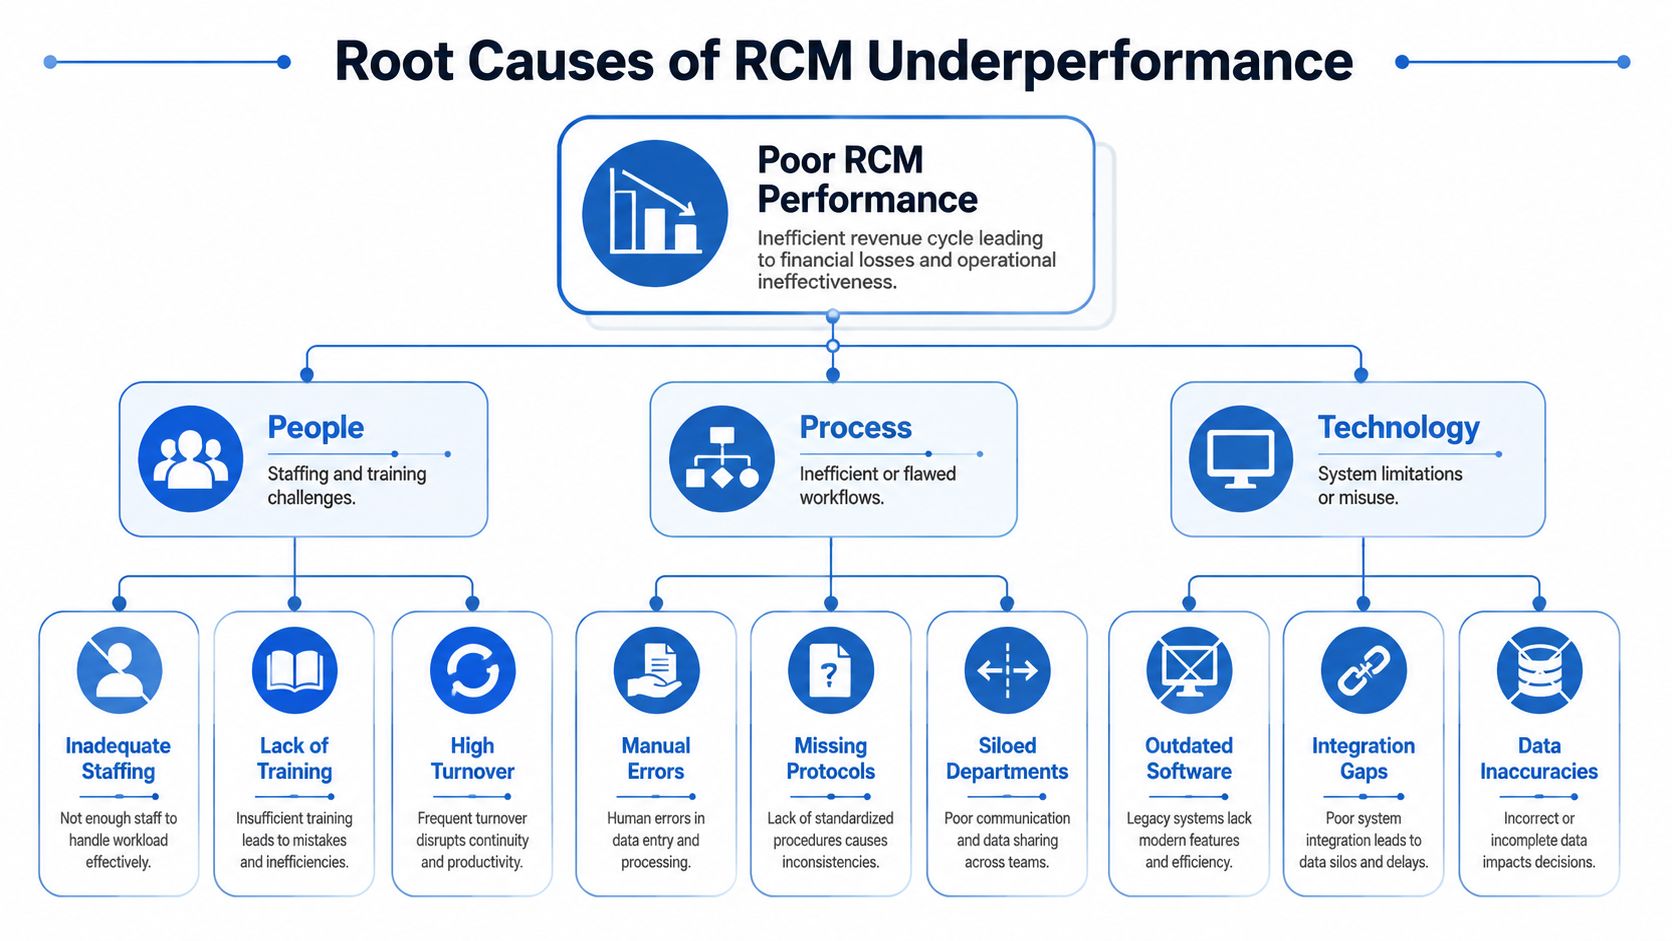
When metrics are weak, practices often jump straight to staffing complaints or payer complaints. Sometimes that's justified. Often it isn't. Most recurring RCM breakdowns fall into three buckets: people, process, and technology.
That framework keeps leadership from guessing. It also prevents the common mistake of buying software to solve a training problem, or hiring more staff to prop up a broken workflow.
People problems
A surprising number of revenue cycle issues are talent and accountability issues in disguise.
Common examples include:
- Inadequate training: Front-desk staff don't understand why subscriber data accuracy matters, so bad information enters the system at intake.
- Role confusion: Coders, billers, and payment posters all touch a problem account, but no one owns final resolution.
- Turnover: New staff inherit workflows nobody documented well, and quality slips before managers catch it.
You can usually spot a people problem when performance varies wildly by staff member, shift, or location.
Process failures
Some practices have good people working inside weak systems. That's a process issue.
Look for failures such as:
No standard intake workflow
Registration quality depends on who is sitting at the desk, not on a defined checklist.Inconsistent charge capture
Clinical work is performed, but charges enter the system late or with missing support.Unstructured denial follow-up
Staff work denials based on urgency or habit, not by category, aging risk, or recovery value.Department silos
Front office, coding, and billing each optimize their own tasks, but nobody manages the handoffs.
Poor RCM performance usually comes from broken handoffs, not isolated effort inside one department.
Technology limits
Technology doesn't have to be old to be ineffective. It just has to be poorly configured, weakly integrated, or underused.
Leaders should investigate whether the current stack creates avoidable manual work. Practice management software, clearinghouse edits, eligibility tools, and reporting systems should work together. If staff are rekeying information, exporting spreadsheets just to understand A/R, or chasing claim status manually, the technology environment is likely amplifying labor costs and error risk.
A real diagnosis usually finds overlap across all three buckets. Staff adapt to bad workflows. Bad workflows get worse when systems don't support them. The key is to identify the primary bottleneck first, then fix in the right order.
Strategic Steps to Improve Revenue Cycle Outcomes
The fastest path to better medical billing performance metrics isn't more reporting. It's a tighter management system. Measure the right things, assign ownership, remove avoidable friction, and review trends often enough to intervene before cash suffers.
Shift quality control upstream
The most important strategic move is to move quality checks closer to patient intake. That includes tighter demographic review, real-time eligibility workflows, and stronger authorization controls before services are rendered.
Practices that wait to catch problems in the billing office are choosing higher-cost correction. Prevention is cheaper than rework, and it protects both staff capacity and collection speed.
A practical leadership agenda should include:
- Front-end QA routines: Audit registration and verification accuracy regularly.
- Coding review discipline: Catch documentation and coding gaps before they produce claim defects.
- Denial category ownership: Assign recurring denial classes to the department that can prevent them.
Use automation where it removes friction
Automation is most useful when it removes repetitive, error-prone work. Eligibility checks, claim status monitoring, work queue routing, and claim edit management are common examples.
What automation shouldn't do is hide broken logic. If your intake workflow is inconsistent, automating parts of it may just help the practice make the same mistake faster. Start with process clarity, then automate the stable parts.
Create accountability that leadership can see
Metrics improve when ownership becomes visible. Every major KPI should have an accountable leader, a review cadence, and a corrective action path.
That doesn't mean turning the dashboard into a punishment tool. It means linking outcomes to operations. If clean claims slip, someone should know why within days. If A/R drifts, someone should already be working the payer, coding, or workflow issue behind it. If denial categories repeat month after month, leadership should require a process fix, not another status update.
The practices that sustain strong revenue cycle outcomes usually do three things well. They review metrics consistently, investigate causes quickly, and act before a financial symptom becomes a chronic operating problem. For many organizations, the most efficient way to build that discipline is to work with a specialized partner that can bring process design, operational bandwidth, and reporting rigor together.
Clarity helps providers strengthen revenue cycle performance without forcing a one-size-fits-all model. As a full-service RCM partner, Clarity supports everything from insurance benefit verification and billing operations to claim status follow-up and payment posting, with engagement options specific to your practice's needs. If your leadership team wants a clearer view of what's hurting collections and a practical plan to improve efficiency, accuracy, and profitability, a complimentary consultation is a smart place to start.
No responses yet