
Your finance team closes the month, publishes the usual reports, and still can't answer the questions that matter. Why are collections soft when charges look healthy? Which payer is slowing cash? Are denials rising because registration is missing eligibility details, because coding changed, or because staff are touching the same accounts too many times without moving them forward?
That's the point where many hospitals and physician groups realize they don't have a reporting problem. They have a visibility problem. Traditional revenue cycle reports tell you what happened after the fact. They rarely tell you where the breakdown started, who needs to act, or which issue deserves leadership attention first.
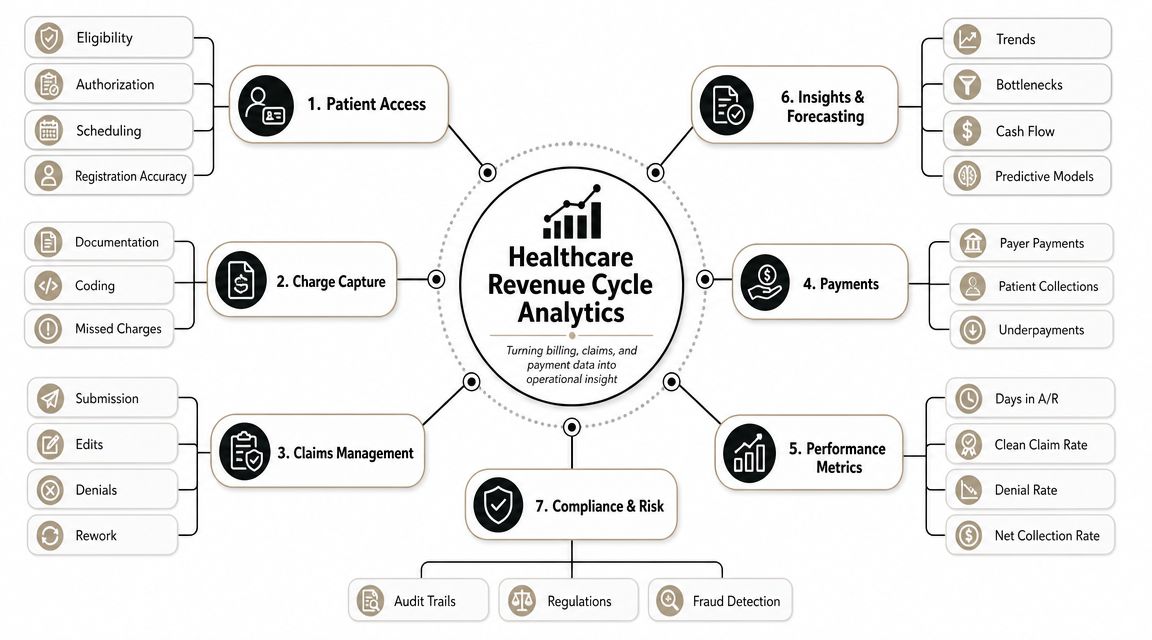
Healthcare revenue cycle analytics changes that. Done well, it becomes a financial command center that connects patient access, coding, claims, payment posting, and collections into one operating view. It helps leaders stop reacting to lagging indicators and start managing reimbursement, payer behavior, workflow design, and contract performance with intent. For a CFO, that shift matters because margin protection rarely comes from one dramatic fix. It comes from finding small points of leakage early and correcting them before they become a cash problem.
Table of Contents
- From Financial Fog to Fiscal Clarity
- What Healthcare Revenue Cycle Analytics Really Means
- Key Performance Indicators to Measure Financial Health
- From Data to Dollars Practical Use Cases and ROI
- An Implementation Roadmap for Lasting Success
- Common Pitfalls and How to Overcome Them
- Conclusion Take Control of Your Financial Future
From Financial Fog to Fiscal Clarity
It is Monday morning. Cash posted last week missed forecast, A/R over 90 days climbed again, and one of your largest commercial payers slowed payment without warning. Revenue cycle leaders are working hard, but each team has a different explanation. Patient access points to eligibility. HIM points to documentation lag. Business office points to payer edits. Finance still cannot answer the question that matters most. What changed, where did it start, and how much margin is at risk?
That is why healthcare revenue cycle analytics matters. A finance team needs more than visibility into denials and aging. It needs a way to connect operational failure, payer behavior, and reimbursement variance to an actual financial decision. Without that connection, organizations spread staff across every queue, escalate the wrong payer issues, and miss contract underperformance until the month is already gone.
The strongest analytics programs do three jobs at once. They show where cash is getting delayed, they identify which workflows deserve more staff time, and they help finance model what is likely to happen next. If a payer starts adding friction during claim adjudication and payment review, the point is not just to count denials. The point is to forecast the cash impact, adjust follow-up priorities, and decide whether the issue belongs in operations, managed care, or both.
I have seen hospitals spend heavily on dashboards that still left leadership guessing. The usual problem is not a lack of reports. It is a lack of cause-and-effect logic. If registration accuracy falls, the CFO should be able to see the downstream effect on initial rejections, delayed billing, and collectible cash. If one payer changes authorization behavior, finance should be able to separate that external shift from internal coding variance and estimate the working capital impact before month-end close.
Practical rule: If a KPI moves and the owner cannot identify the workflow, payer, or contract term behind it, the report is not yet useful for management.
Used well, analytics turns the revenue cycle from a cleanup function into a financial management system. Frontline managers use it to assign work where it is most likely to produce cash. Directors use it to fix repeat failure points instead of chasing backlog. CFOs use it to challenge payer performance, test staffing choices, and make contract decisions with better timing and less guesswork.
What Healthcare Revenue Cycle Analytics Really Means
Monday starts with a cash forecast miss. Gross charges look healthy, but net collections are trailing plan, AR days are drifting up, and no one can say whether the problem started in patient access, coding, payer edits, or contract underpayments. Revenue cycle analytics exists to answer that question fast enough to change the outcome, not just explain it after close.
Why the old reporting model falls short
Traditional reporting summarizes what happened. Revenue cycle analytics explains why it happened, where it started, and what it is likely to do to cash if no one intervenes.
That difference matters because revenue leakage rarely comes from one clean failure point. Incomplete insurance data at registration can increase edits and initial rejections. Documentation gaps can delay coding. Claims can stall during the steps of payer claim adjudication and payment review. Payment posting can hide underpayments when expected reimbursement is not tied back to contract terms. By the time finance sees the result in month-end reporting, the operational error has already turned into delayed cash or a write-off risk.
A hospital does not need more disconnected scorecards. It needs a financial signal chain that links front-end actions, payer responses, staff work queues, and final reimbursement.
The difference between reporting and analytics
A static report shows denial rate increased. Analytics breaks that increase into payer, denial code family, service line, location, claim dollar value, and staff workflow. It also shows sequence. Did eligibility accuracy slip first? Did one payer change authorization edits? Did a contract carve-out stop paying as expected? Those are management questions, not reporting questions.
For a CFO, the practical value is broader than denial reduction. Good analytics supports three decisions that affect margin.
- Payer behavior management. Finance can spot when a payer starts slowing medical necessity reviews, increasing clinical documentation requests, or shifting denial patterns by service line. That helps leadership estimate cash impact early, escalate the issue with evidence, and decide whether the response belongs with operations, managed care, or both.
- Staffing and workflow optimization. Work queues should not be staffed by age alone. Analytics can show which accounts, payers, or denial categories produce the highest net recovery per staff hour. That changes how teams assign follow-up, where specialist staff are needed, and whether automation is reducing labor or just relocating rework.
- Contract performance modeling. Posted payments should be measured against expected allowed amounts, denial behavior, and avoidable variance. That lets finance identify contracts that look acceptable on headline rates but perform poorly in practice because of authorization friction, bundling logic, or slow payment patterns.
This is the operational logic many organizations miss. They buy a dashboard, but the underlying data remains inconsistent. Registration fields are free-text. Denial categories vary by team. Payer IDs do not reconcile across systems. Staff actions are logged inconsistently. In that environment, the charts may look polished, but they cannot support decisions about reserves, staffing levels, or payer negotiations.
Good revenue cycle analytics is a management system. It connects daily workflow to net revenue, cash timing, and contract value so leadership can act before operational variance becomes a financial surprise.
Key Performance Indicators to Measure Financial Health
A CFO does not need a wall of revenue cycle metrics. The dashboard needs a small set of indicators that answer three questions fast. Are we converting earned revenue into cash on time? Where is margin leaking? Which problem deserves management attention now?
That KPI set should do more than flag cleanup work. It should support forecasting, labor decisions, and payer strategy.
Front-end metrics that protect revenue before the bill drops
Clean-claim rate measures whether claims leave the organization without errors that trigger avoidable rework. High-performing organizations target 95% or better, based on Enter's revenue cycle analytics benchmark summary. If that rate slips, finance should not stop at "claims edits are failing." The better question is where quality is breaking down. Registration accuracy, eligibility verification, authorization capture, charge integrity, and coding all feed this number.
First-pass yield shows how often claims are paid correctly on the initial submission. Enter cites 90% to 93%+ as the range associated with strong performance. I watch this metric closely because it converts process friction into a direct financial signal. A two-point drop usually means more touches per account, slower cash, and higher labor cost, even before denials show up in monthly reporting.
These two front-end measures also help with staffing decisions. If first-pass yield is weak in one specialty but clean-claim rate is stable, the issue may sit in coding edits or payer-specific billing rules, not in registration. That distinction matters. It changes whether leadership adds front-end training, reassigns denial specialists, or presses a vendor to fix claim logic.
Back-end metrics that show whether revenue is turning into cash
Denial rate still belongs on every executive dashboard, but it becomes more useful when tied to financial exposure. A denial rate under 5% is a common benchmark from the same Enter source. On its own, though, that number can mislead. A hospital can post an acceptable overall denial rate while one payer or one service line is creating a disproportionate share of avoidable write-offs, delayed cash, or staff rework.
Days in A/R measures how quickly the organization converts billed revenue into payment. Enter lists below 45 days as a common target. For finance leaders, this is a working capital metric as much as an operations metric. Rising A/R days can signal slower payer adjudication, weak follow-up productivity, or an aging inventory of claims that were flawed from the start. Each cause requires a different response.
Net collection rate rounds out the picture because it shows how much collectible reimbursement the organization realizes after contractual adjustments. Teams that want a practical definition can review this explanation of how net collection rate reflects collectible revenue performance. A stable denial rate with a declining net collection rate often points to underpayments, write-off practices, or contract terms that look acceptable on paper but perform poorly in practice.
Board-level lens: The best KPI is the one that changes an operating or financial decision this week.
Essential Healthcare RCM Analytics KPIs and Benchmarks
| KPI | What It Measures | Industry Benchmark |
|---|---|---|
| Clean-claim rate | Percentage of claims submitted without errors requiring rework | 95% or higher |
| Denial rate | Share of claims denied by payers | Below 5% |
| Days in A/R | Average time to collect payment after service | Below 45 days |
| First-pass yield | Percentage of claims paid correctly on initial submission | Over 90%, with 93%+ often cited as high performance |
All benchmarks above are from Enter.
One more caution. Benchmarks are starting points, not management goals by themselves. A payer with slower payment behavior, higher authorization friction, or frequent underpayment can hurt cash performance even when headline KPIs look acceptable. The stronger use of analytics is to connect these measures to contract modeling, queue design, and payer escalation, so leadership can decide where to intervene before a volume increase turns into a cash shortfall.
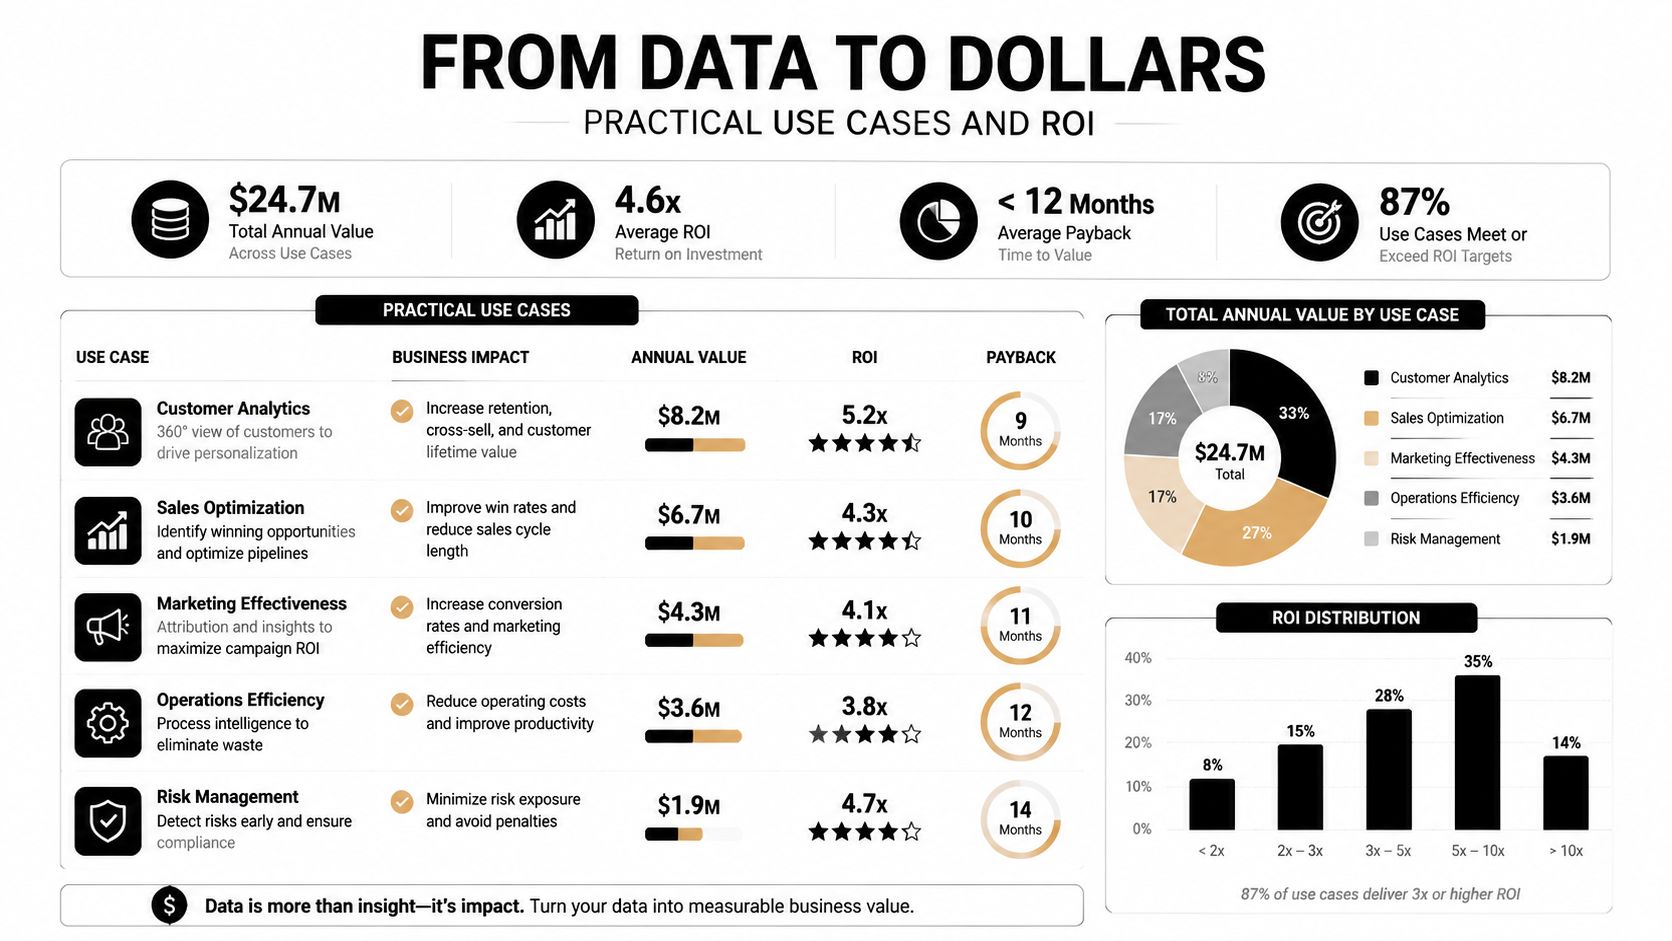
From Data to Dollars Practical Use Cases and ROI
The true test of healthcare revenue cycle analytics is simple. Does it change behavior in a way that protects or accelerates cash?
Payer behavior is now a finance issue
Many organizations still use analytics mainly to count denials after they happen. That's too narrow for the current payer environment. One industry source notes that denial rates for some exchange plans reached 20% in 2023, while prior authorization use has expanded, making payer complexity an upstream revenue risk rather than just a back-end collections problem, as discussed in GreenHive's guide to strategic revenue cycle analytics.
That changes how a CFO should use analytics. The right question isn't only "How do we reduce denials?" It's also:
- Which payer creates the most friction before claim submission?
- Which service lines face repeated prior-auth bottlenecks?
- Where do expected reimbursement and actual payment begin to diverge?
- Which payer behaviors should shape contracting strategy, staffing design, or escalation rules?
A practical example: a service line sees rising charge volume, but cash doesn't move with it. Traditional management may push coders or billers to work faster. Strategic analytics checks whether one payer is delaying authorizations, whether edits are clustering around one procedure family, or whether underpayments are appearing after adjudication. Those are different problems with different owners.
Workflow analytics shows which work actually produces cash
This is the area most dashboards miss. Finance leaders often see balances, denials, and aging, but they don't see what staff are doing inside the work queues.
Operationally mature teams link account outcomes to workflow activity: touches per account, account age by work queue, reopen rates, time between touches, and which actions precede payment versus rework. That allows leaders to separate productive follow-up from motion that only looks busy.
One practical option is working with a partner that can combine reporting with operational execution. For example, Clarity's medical revenue recovery services focus on claim status, follow-up, and payment visibility, which makes this kind of workflow-linked analysis more actionable than a dashboard alone.
The fastest way to waste labor is to measure account volume without measuring whether each touch moved the account closer to payment.
In practice, workflow analytics helps answer uncomfortable but valuable questions. Are senior staff spending time on low-value follow-up? Are some work queues recycling the same accounts because ownership is unclear? Are denials being "worked" repeatedly without fixing the registration or authorization issue that created them?
Contract modeling closes the gap between expected and actual reimbursement
A third use case sits squarely in strategic finance. Analytics can compare contract expectations with actual payment behavior by payer and service line. That matters because not every reimbursement problem is a denial problem. Some are underpayment patterns, contract interpretation issues, or payment-posting blind spots.
A CFO can use this model in three ways:
- Payer segmentation. Group payers by denial behavior, authorization burden, underpayment tendency, and speed to pay.
- Negotiation preparation. Bring pattern evidence into payer discussions instead of isolated examples.
- Margin forecasting. Estimate where reimbursement pressure is likely to show up before it distorts monthly performance.
That's where healthcare revenue cycle analytics becomes a strategic asset. It stops being a back-office diagnostic tool and starts informing budgeting, staffing, payer strategy, and service line decisions.
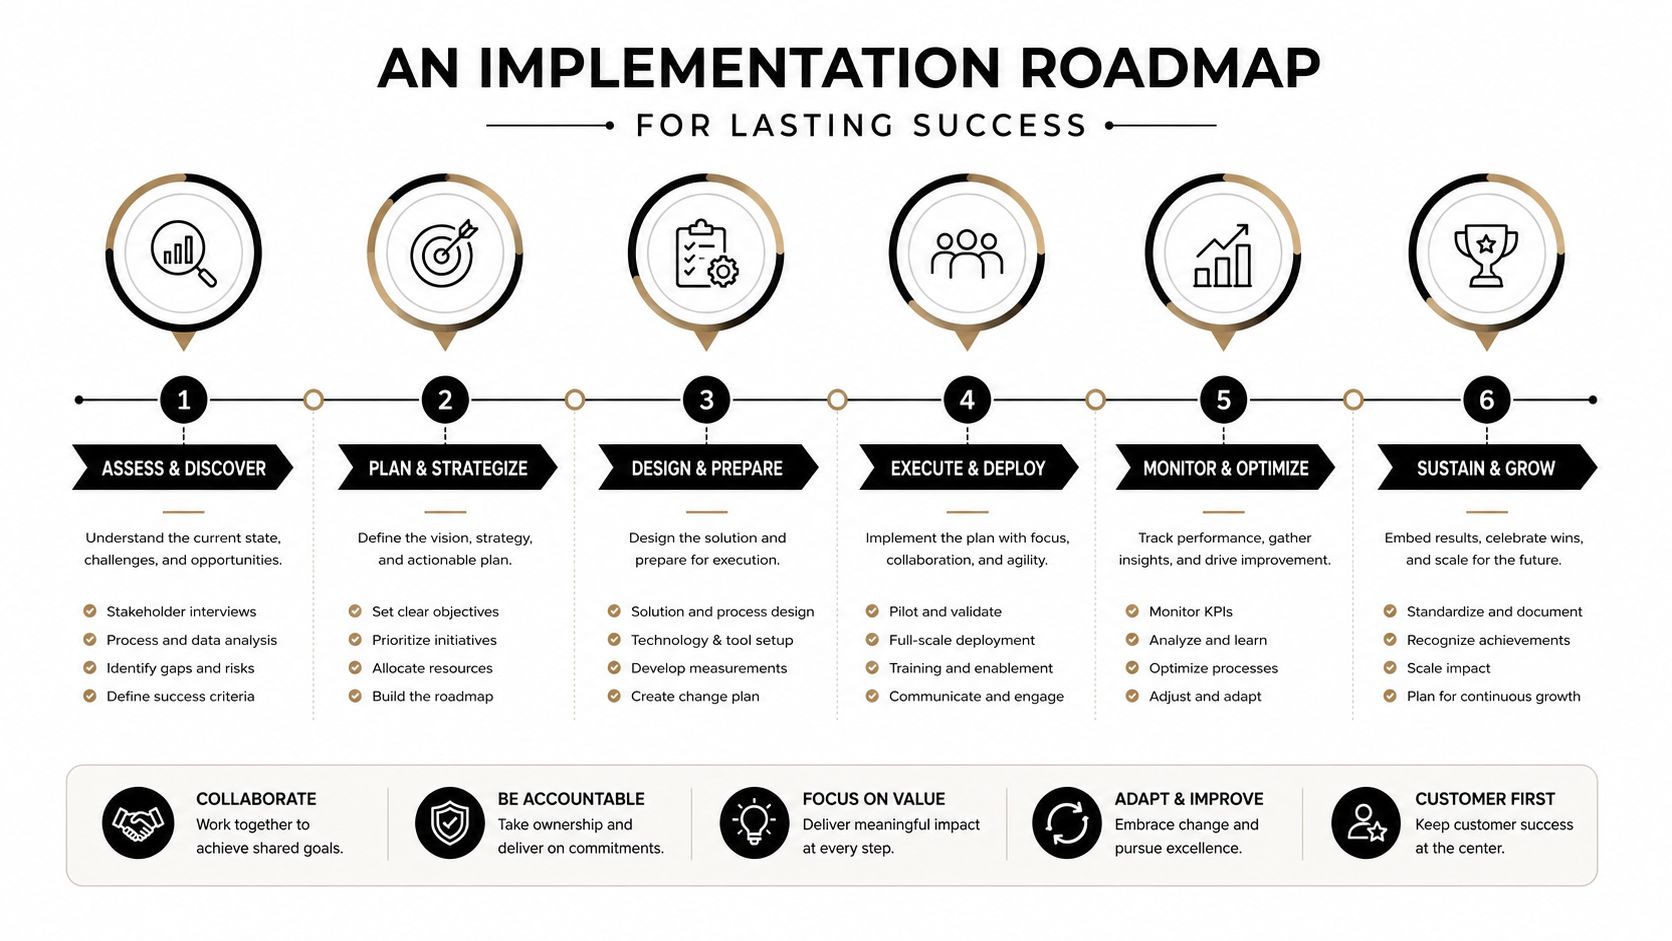
An Implementation Roadmap for Lasting Success
Most analytics projects fail for a predictable reason. The organization treats them as a technology purchase instead of an operating model change.
People and process first
Start with ownership, not software. If no one owns denial categorization, eligibility standards, work queue design, and monthly variance review, analytics will expose problems without creating resolution.
A workable roadmap usually begins with four decisions.
- Name metric owners. Each major KPI needs a business owner, not just an analyst. Denial rate may sit with revenue cycle leadership, but authorization-related denials should also involve patient access or utilization review leaders.
- Map the handoffs. Analytics gets stronger when the organization can identify where data changes hands. Registration to coding. Coding to billing. Billing to follow-up. Follow-up to payment posting.
- Set review cadences. Some metrics belong in daily huddles, others in weekly operational reviews, and others in monthly finance meetings.
- Define escalation logic. Teams need agreement on when a trend becomes a leadership issue rather than a staff-level clean-up task.
A critical implementation step is establishing a baseline. Meaningful trend detection typically requires roughly 3 to 6 months of historical data, which helps leaders distinguish one-off variance from structural reimbursement or A/R problems, according to JTS Health Partners' discussion of trend separation in revenue cycle analytics.
Operating advice: Don't launch dashboards before you've agreed on definitions, owners, and meeting cadence. Otherwise every review becomes a debate about the numbers instead of a decision about action.
Technology and data governance that people trust
Technology comes after process discipline. The tool can be a BI platform, a vendor dashboard, internal reporting layer, or a managed partner model. The harder question is whether the data can be trusted at the claim, payer, and account level.
Strong implementations focus on a few practical standards:
- Common definitions: Denial categories, financial classes, service lines, and work queue statuses need to mean the same thing everywhere.
- Source alignment: EHR, billing system, clearinghouse, and payer files must reconcile well enough that leaders aren't comparing conflicting versions of reality.
- Role-based visibility: Executives need trend and variance. Managers need queue-level and staff-level drill-down. Staff need next actions.
- Governance discipline: When a metric changes, someone should know whether the business changed or the data logic changed.
The build-versus-buy decision should be framed around speed, internal capability, and maintenance burden. Building internally can work if the organization already has integration expertise, disciplined data governance, and finance leaders willing to sponsor adoption. Partnering often works better when teams need faster implementation, stronger operational interpretation, or support across billing functions.
In either model, don't confuse access to data with management control. Lasting success comes from repeated review, clear accountability, and a willingness to redesign workflows after the analytics exposes what's broken.
Common Pitfalls and How to Overcome Them
A CFO reviews the monthly dashboard and sees a denial spike, slower cash from a major payer, and higher A/R in one service line. Everyone agrees the numbers are concerning. Two weeks later, nothing has changed because no one translated the signal into a financial decision, an operational response, or a contract question.
That is where revenue cycle analytics breaks down in practice. The failure points are usually predictable. Organizations miss them because software is easier to install than management discipline is to maintain.
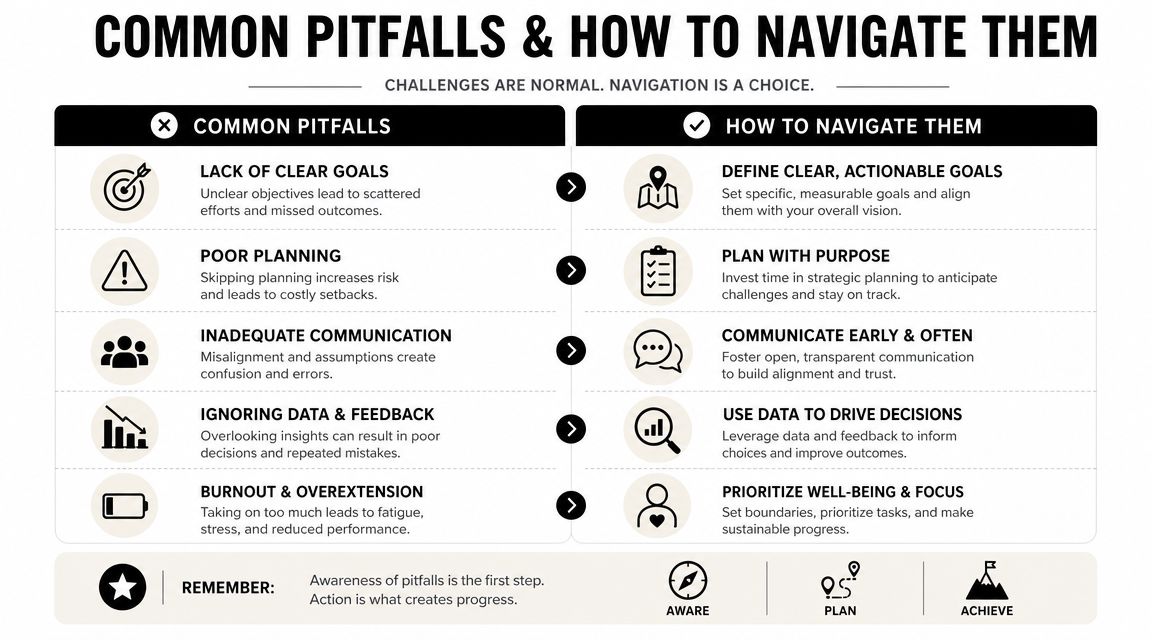
Trap one dashboards that don't trigger action
A polished dashboard can create false confidence. Red, yellow, and green status indicators look useful in a board packet, but they do not improve cash by themselves. A metric matters only when it answers a management question and triggers a defined response.
For example, if denial rate rises, the first question is not whether the dashboard is accurate. The first question is where to intervene for financial return. One payer may require immediate escalation because underpayments are increasing alongside denials. Another may call for front-end retraining because authorization failures are concentrated in a single scheduling workflow. A third may justify contract review if the payer is consistently shifting edits beyond agreed terms.
Set the rule in advance. Every KPI should have an owner, a decision path, and a time frame for follow-up. Without that structure, analytics becomes a reporting exercise instead of a financial control system.
Trap two financial reporting without workflow evidence
Many organizations can show where cash slowed down. Fewer can show what staff activity, queue design, or handoff pattern contributed to the delay.
That gap matters. A denial dashboard may identify a problem category, but it will not tell a CFO whether the actual issue is poor registration quality, unnecessary account rework, or a work queue that routes the same account through three different teams before anyone resolves it. Those are different problems with different cost profiles.
A stronger approach connects financial outcomes to operational behavior, as discussed in this discussion of workflow-linked revenue cycle analytics. The goal is not more activity tracking for its own sake. The goal is to determine which staff actions effectively move accounts toward payment and which ones consume labor without changing the result.
That usually means focusing on a few practical questions:
- Which account touches changed status? High touch volume can signal productivity, or it can signal rework.
- Which queues create avoidable delay? Serial handoffs often inflate labor cost and hide ownership gaps.
- Which teams affect cash fastest? Posting activity, denial follow-up, authorization correction, and documentation review do not produce the same return at the same speed.
- Where should staffing shift first? Analytics should help leaders decide whether to add FTEs, redesign queue rules, or move work upstream.
If analytics shows where dollars stalled but not what happened in the workflow at that point, the root cause is still incomplete.
Trap three too much data and no financial baseline
Teams often launch analytics and start reacting to every variance. That creates noise, not control. Without a baseline, leaders cannot tell whether a change reflects seasonality, payer behavior, a coding shift, or a one-time operational disruption.
Start with a small set of measures that matter to margin and cash. Then establish the normal range for each one by payer, service line, and workflow stage where appropriate. Once that baseline is stable, outliers become more useful. They can point to a contract performance issue, a staffing bottleneck, or a payer pattern that deserves escalation before it affects the quarter.
Metric sprawl creates another problem. Finance asks for one view, operations asks for five more, and each manager wants custom filters. Soon the organization has dozens of tabs and no shared focus. Good analytics reduces decision fatigue. It helps leaders see which variance deserves attention now, which one should be monitored, and which one is just background fluctuation.
Conclusion Take Control of Your Financial Future
Healthcare revenue cycle analytics has matured from a reporting function into a core financial capability. For a CFO, its value isn't just cleaner dashboards or faster monthly reviews. It's the ability to connect reimbursement performance, payer behavior, workflow design, and contract execution into one management system.
The organizations that get the most from analytics don't stop at denial cleanup. They use data to see where front-end friction starts, how staff effort translates into cash, which payers create structural risk, and where contract performance drifts from expectation. They build trust in the data, assign owners to the metrics, and use trend analysis to separate noise from real financial leakage.
That level of visibility gives leaders more control over margin and more time to focus on patient care delivery instead of financial firefighting. In the current payer environment, that isn't optional. It's basic financial discipline.
If you want an outside view of where your revenue cycle is leaking and which analytics priorities will matter most, schedule a complimentary consultation with Clarity. Their team can assess your current workflows, reporting gaps, and operational handoffs, then outline a customized plan to improve efficiency, accuracy, and financial performance.
2 Responses
[…] this context, healthcare revenue cycle analytics becomes relevant. The role makes sense only when leadership sees claims as data, not just […]
[…] That is why old-school RCM visibility isn't enough anymore. Clean claims and low A/R don't protect revenue when the underlying illness burden is undercaptured. Strong front-end and back-end operations still matter, but leadership also needs a risk-adjustment lens alongside healthcare revenue cycle analytics. […]